ISSN: 1449-2288International Journal of Biological Sciences

Int J Biol Sci 2008; 4(1):37-47. doi:10.7150/ijbs.4.37 This issue Cite
Research Paper
Activation of the FGF signaling pathway and subsequent induction of mesenchymal stem cell differentiation by inorganic polyphosphate
Yumi Kawazoe1,2, Shinichi Katoh1, Yuichiro Onodera2, Takao Kohgo2, Masanobu Shindoh2, Toshikazu Shiba1 ![]()
1. Regenetiss Inc., 1-9-4, Asahigaoka, Hino, Tokyo 191-0065, Japan.
2. Graduate School of Dental Medicine, Hokkaido University, Sapporo, Hokkaido 060-8586, Japan.
Abstract
Inorganic polyphosphate [poly(P)] is a biopolymer existing in almost all cells and tissues, although its biological functions in higher eukaryotes have not been completely elucidated. We previously demonstrated that poly(P) enhances the function of fibroblast growth factors (FGFs) by stabilizing them and strengthening the affinity between FGFs and their cell surface receptors. Since FGFs play crucial roles in bone regeneration, we further investigated the effect of poly(P) on the cell differentiation of human stem cells via FGF signaling systems. Human dental pulp cells (HDPCs) isolated from human dental pulp show the characteristics of multipotent mesenchymal stem cells (MSCs). HDPCs secreted FGFs and the proliferation of HDPCs was shown to be enhanced by treatment with poly(P). Cell surface receptor-bound FGF-2 was stably maintained for more than 40 hours in the presence of poly(P). The phosphorylation of ERK1/2 was also enhanced by poly(P). The effect of poly(P) on the osteogenic differentiation of HDPCs and human MSCs (hMSCs) were also investigated. After 5 days of treatment with poly(P), type-I collagen expression of both cell types was enhanced. The C-terminal peptide of type-I collagen was also released at higher levels in poly(P)-treated HDPCs. Microarray analysis showed that expression of matrix metalloproteinase-1 (MMP1), osteopontin (OPN), osteocalcin (OC) and osteoprotegerin was induced in both cell types by poly(P). Furthermore, induced expression of MMP1, OPN and OC genes in both cells was confirmed by real-time PCR. Calcification of both cell types was clearly observed by alizarin red staining following treatment with poly(P). The results suggest that the activation of the FGF signaling pathway by poly(P) induces both proliferation and mineralization of stem cells.
Keywords: inorganic polyphosphate, FGF, osteogenic differentiation, cell calcification, mesenchymal stem cell, dental pulp cell
1. Introduction
Inorganic polyphosphate [poly(P)] is a widely used material in food additives and cosmetics. Although poly(P) has also been found as a biopolymer in a wide range of organisms, including most prokaryotes and eukaryotes, and in the tissues of higher plants and animals [1-7], little research has been done in higher forms to elucidate the physiological functions of poly(P).
The biological functions of poly(P) have been investigated primarily in microorganisms, and there have been only a few reports on its functions in eukaryotes. We previously reported that poly(P) enhanced the proliferation of human fibroblasts, both by stabilizing fibroblast growth factors (FGF-1 and FGF-2) and by enhancing the affinity between FGFs and their cell surface receptors [8]. In an in vitro study using osteoblast-like MC3T3-E1 cells, we revealed that poly(P) induces the expression of markers of bone differentiation and cell calcification [9]. We have also shown that poly(P) can accelerate periodontal tissue regeneration, including alveolar bone formation, in rats that have artificial defects in periodontal tissue [10].
Many in vivo studies have shown that FGF-2 is a potent inducer of bone regeneration [11-13]. However, the in vitro effect of FGF-2 on cell mineralization is still obscure. Some studies have shown that an FGF-2 inhibits collagen and alkaline phosphatase production and the mineralization of osteoblasts when the cells were continuously stimulated by FGF-2 [14-16]. On the other hand, it has been shown that FGF-2 accelerates the mineralization of osteoblasts and multipotent stem cells (MSCs) when those cells were exposed to the FGF only during the late stage of cell mineralization [17-19]. In addition, it has been demonstrated that the dexamethasone-dependent osteogenic differentiation of MSCs is induced by FGF-2 and that combined treatment with FGF-2 and BMP-2 synergistically enhanced the osteogenic potency of FGF-2 in MSC cultures [20]. Although FGF-2 could have a basic potential to induce cell mineralization, it may be difficult to reproduce the prominent in vivo effect of FGF-2 in vitro.
It has recently been reported that human dental pulp contains multipotent MSCs that have the potential to differentiate into odontoblasts, adipocytes and neuronal cells [21,22]. In order to examine the effect of poly(P) on the differentiation of MSCs, we isolated human dental pulp cells, HDPCs, which have the defining characteristics of MSCs. If poly(P) is shown to accelerate the calcification of HDPCs, poly(P) may be useful as an inducer for dentin formation. Also, since FGFs play crucial roles in bone regeneration as well as in soft tissue repair [11-13], it is reasonable to assume that poly(P) is an accelerator of the differentiation of MSCs to bone through the stabilization of FGFs. Since poly(P) is a safe material with very low toxicity, it could be easily applied for medical use as a biodegradable material.
In this study, we examined the effect of poly(P) on the proliferation and differentiation of MSCs via activation of the FGF signaling pathway.
2. Materials and Methods
Materials
Human mesenchymal stem cells (hMSCs) and their growth medium (MSCBM BulletKit) were purchased from Cambrex Bio Science Walkersville. Eagle's minimum essential medium alpha modification (α-MEM) and fetal bovine serum (FBS) were obtained from Sigma. Unless otherwise indicated, α-MEM used in the experiments contained 50 μg/ml kanamycin and 0.292 mg/ml L-glutamine. Poly(P) having an average chain length of 60 phosphate residues was prepared and its characteristics (molecular weight and its distribution) were determined by gel electrophoresis as previously described [9]. Poly(P) concentrations are represented in terms of phosphate residues. A Human Mesenchymal Stem Cell Functional Identification Kit (hMSC-FI kit), anti-human FGF-2 antibody and recombinant human FGF basic (FGF-2) were purchased from R & D Systems. An antibody to human type-I collagen was obtained from Chemicon International. FITC-conjugated anti-rabbit IgG, alkaline phosphatase-conjugated anti-rabbit IgG and horseradish peroxidase-conjugated anti-goat IgG antibodies were purchased from Bio-Rad. Alexa Fluor® 568-labeled donkey anti-goat IgG antibody was purchased from Molecular Probes. A Cellular Activation of Signaling ELISA CASETM Kit for ERK1/2 T202/Y204 was purchased from SuperArray Bioscience, and a Procollagen type-I C-terminal peptide EIA kit was purchased from Takara Bio (Japan). A Human 1A Oligo Microarray Kit was purchased from Agilent Technologies. Other chemicals were obtained from Wako Pure Chemicals (Japan).
Isolation of HDPCs
Human dental pulp cells (HDPCs) were derived from the detached primary tooth of an 8-year-old boy. Cells in the dental pulp were removed and transferred into type-I collagen-coated 12-well cell culture plates and then cultured in α -MEM supplemented with 10% FBS and antibiotics [a mixture of 50 μg/ml kanamycin, 10 μg/ml tetracycline, 100 μg/ml ampicillin and 100 ng/ml fungisone (amphotericin B)], at 37˚C in a humidified atmosphere of 5% CO2 in air. The medium was changed every day, and when the cells had become confluent, they were trypsinized and seeded into a 60-mm culture dish. HDPCs were subsequently maintained in α-MEM supplemented with 10% FBS at 37˚C in a humidified atmosphere of 5% CO2 in air.
Characterization of HDPCs
For chondrogenic differentiation, pelleted HDPCs (2.5x10⁵ cells/each) were cultured in a 15-mL conical tube, and the cells were treated with a chondrogenic cocktail containing dexamethasone, ascorbate-phosphate, proline, pyruvate and TGF-β3, all supplied with the hMSC-FI kit. After 24 days of treatment with the chondrogenic cocktail, the cell pellet was fixed using 4% paraformaldehyde in PBS and sectioned using standard cryosectioning methods. For adipogenic differentiation, HDPCs (2x10⁴ cells/well) were cultured on a Lab-Tek® Chamber-SlideTM system (Nunc). The cells were treated for 30 days with the adipogenic cocktail, containing hydrocortisone, isobutylmethylxanthine and indomethacin, supplied with the hMSC-IF kit. Differentiation of HDPCs into chondrocytes was determined in the cryosectioned sample by immunohistochemical methods for detecting aggrecan using goat anti-aggrecan antibody and Alexa Fluor® 568-labeled donkey anti-goat IgG antibody. Hematoxylin-eosin (HE) staining was also performed using a standard protocol. To confirm the differentiation into chondrocytes, alcian blue staining was also performed, as previously described [23].
Cell proliferation assay
HDPCs were seeded on 96-well cell culture plates at a density of 4,000 cells/well and maintained in α-MEM supplemented with 10% FBS. After incubation for 24 hours, the medium was replaced with serum-free α-MEM, and the cells were further incubated for 24 hours prior to the addition of 0.2 ~ 1 mM of poly(P), which is an optimal concentration range for cell proliferation. Cell proliferation after 21 hours and 45 hours of cultivation was determined using a CellTiter 96® AQueous One Solution Cell Proliferation Assay Kit (Promega).
Detection of intracellular and cell surface receptor-bound FGF-2
HDPCs were plated on a 100-mm culture dish at a density of 5x10⁵ cells/dish and maintained in α-MEM supplemented with 10% FBS (growth medium). After the cells had become confluent, they were washed with serum-free α-MEM to remove any residual FGF-2 from the growth medium. After washing the cells, the medium was replaced with serum-free α-MEM, and the cells were further incubated for 12 hours.
To analyze the production and stability of FGF-2, intracellular FGF-2 and cell surface receptor-bound FGF-2 were quantified as follows. After 12 hours of incubation with serum-free α-MEM, both FGF-2 located at the cell surface (cell surface receptor-bound FGF-2) and intracellular FGF-2 were collected. Cell surface receptor-bound FGF-2 was collected as previously described [8, 24]. After removing receptor-bound FGF-2, the remaining cells were washed twice with PBS before the cells were scraped. Scraped cells were collected and suspended in 20 mM Tris-HCl (pH 7.5) and ultrasonicated on ice, and the protein concentration was measured using a BCA protein assay kit (PIERCE). The amounts of FGF-2 located both at the cell surface and inside the cells (self-produced FGF-2) were estimated by Western blotting [25].
The stability of FGF-2 bound to its cell surface receptor was also examined. After HDPCs had become confluent, the cells were incubated with serum-free α-MEM containing purified human recombinant FGF-2 at a final concentration of 40 ng/ml in the presence or absence of poly(P) (1 mM). After 20 and 40 hours of incubation, cell surface receptor-bound FGF-2 was collected as previously described [8]. The amount of FGF-2 was estimated by Western blotting.
Determination of ERK1/2 phosphorylation level in HDPCs
HDPCs were seeded on 96-well plates at a density of 2,000 cells/well. After 24 hours of incubation, the culture medium was replaced with serum-free α-MEM, and the cells were further incubated for 18 hours prior to poly(P) treatment. The cells were then treated with serum-free α-MEM containing poly(P) (0.2 mM or 1 mM) or human recombinant FGF-2 (12.5 ng/ml) for 24 or 48 hours. The phosphorylation level of intracellular ERK1/2 was determined using the Cellular Activation of Signaling ELISA CASETM Kit for ERK1/2 T202/Y204, following the manufacturer's instructions. The total amounts of ERK1/2 and phosphorylated ERK1/2 were estimated by this ELISA kit using anti-ERK1/2 and anti-phosphorylated ERK1/2 antibodies, respectively.
Induction of cell calcification
In order to estimate the level of collagen expression, mRNA expression determined both by RT-PCR and microarray analyses, and calcium deposition, cells were cultured as follows. HDPCs and hMSCs were plated on 60-mm culture dishes at a density of 1x10⁵ cells/dish and maintained in their respective growth media. For alizarin red staining, cells were plated on 12-well cell culture plates at a density of 1x10⁴ cells/well. After the cells had become confluent, the medium was replaced with α-MEM supplemented with 1% FBS. Poly(P) (1 mM) was added to the culture media if necessary, and the cells were further incubated. The culture medium, which was supplemented with poly(P) or not supplemented with poly(P), was replaced every fourth day.
Detection of type-I collagen and quantification of its C-terminal peptide
Expression levels of type-I collagen in HDPCs and hMSCs after 5 days of treatment were analyzed and quantified by immunostaining. The method for the induction of cell differentiation is described above. After 5 days of incubation, cells were fixed with phosphate-buffered formaldehyde and the expression of type-I collagen was detected by immunohistochemical methods using an FITC-labeled secondary antibody. Nuclei were stained with 10 ng/mL 4',6-Diamidino-2-phenylindole (DAPI). Each fluorescent image of type-I collagen (visualized using FITC) and nuclei (DAPI) was captured and analyzed using a fluorescent microscope and an image analysis system (Leica Microsystems). Relative type-I collagen expression levels were calculated by dividing the FITC fluorescence intensity by the number of cells (nuclei). The relative fluorescent intensity is presented as the average value of 3 areas of each treatment group.
The secretion level of the type-I collagen C-terminal peptide (PIP) in the cell culture supernatant was estimated as follows. HDPCs were seeded on 96-well plates at a density of 2,000 cells/well, and cell differentiation was induced as described above. For each culture, the medium was collected every fourth day, and the total amount of PIP in the culture medium was determined using the procollagen type-I C-terminal peptide EIA kit, following the manufacturer's instructions.
Quantification of mRNA levels by real-time PCR
Total RNA was obtained using an SV Total RNA Isolation System (Promega), following the manufacturer's instructions. Reverse transcription reactions were performed using an oligo dT (20-mer) primer and ReverTra AceTM (TOYOBO) for 30 minutes at 42˚C. The synthesized cDNAs were used for quantitative PCR analysis with specific primers designed to hybridize to the exon/ intron junctions. Quantification of glyceraldehyde 3-phosphate dehydrogenase (GAPDH) mRNA (as an internal control for gene expression in the cells) was performed using TaqMan® Human GAPDH Control Reagents (with VICTM Probe, Applied Biosystems). The expression of matrix metalloproteinase-1 (MMP-1) mRNA was detected using SYBR® Green. Detection of osteopontin (OPN) and osteocalcin (OC) mRNAs was performed using TaqMan® FAM-MGB probes. The sequences of the designed primers for detection of MMP1, OPN and OC and the sequences of the TaqMan® FAM-MGB probes for OPN and OC are shown in the legend of Figure 5. Quantitative PCR analysis was performed using an ABI Prism 7000 Sequence Detection System and TaqMan® Universal PCR Master Mix for detection of OPN and OC mRNA and using SYBR® Green PCR Master Mix for detection of MMP-1 mRNA (both provided by Applied Biosystems) with 40 cycles of 95˚C for 15 seconds and 60˚C for 1 minute, following the manufacturer's protocol. Each mRNA expression level was normalized by the expression level of GAPDH, and the relative expression level of each gene is shown as a relative value when the expression level of day 0 was set at 1.
Microarray analyses
Total RNA of poly(P)-treated and non-treated cells was purified from both HDPCs and hMSCs at 21 days after treatment using an SV Total RNA Isolation System (Promega) according to the manufacturer's instructions. Each 500 μg of isolated total RNA was used to amplify and synthesize cRNA, and each 0.75 μg of synthesized cRNA probes from non-treated cells and that from poly(P)-treated cells were labeled with cyanine 3-labeled CTP and cyanine 5-labeled CTP, respectively. Then gene expressions were analyzed by hybridizing the labeled cRNA probes to a human 1A oligonucleotide microarray version 2, which contains 18,716 known human genes. The array was scanned by an Agilent dual-laser DNA microarray scanner, and the data were extracted by Feature Extraction software (Agilent Technologies).
Alizarin red staining
Following the method for the induction of cell differentiation described above, HDPCs and hMSCs were treated with 1 mM of poly(P) for 34 days and 24 days, respectively. The cells were washed once with PBS and fixed with phosphate-buffered formalin for 20 min. Fixed cells were washed once with distilled water and subsequently stained with 1% alizarin red S dissolved in distilled water for 5 min. The remaining dye was washed out with distilled water, and the cells were washed once more. Finally, the cells were air-dried and images of the stained cells were captured using a light microscope and its image analyzing software (Leica).
3. Results
Characterization of HDPCs derived from human dental pulp
In order to confirm that HDPCs isolated from human dental pulp contain multipotent MSCs, the cells were treated with both the chondrogenic cocktail and the adipogenic cocktail (see Materials and Methods) to induce cell differentiation into chondrocytes and adipocytes, respectively. After 24 days of treatment with the chondrogenic cocktail, HDPCs were stained with both alcian blue (Fig. 1A) and anti-aggrecan antibody (Fig. 1B), indicating that the cells had differentiated into chondrocytes. Hypertrophic cells, which correspond to differentiated chondrocytes, were also observed at the peripheral area of the cell pellet (Fig. 1C). In addition, some populations of HDPCs produced lipid particles after 30 days of treatment with the adipogenic cocktail described above (Fig. 1D and 1E). These results suggest that HDPCs have multipotent ability to differentiate into both chondrocytes and adipocytes. These findings are consistent with the results of previous studies showing the existence of multipotent mesenchymal stem cells (MSCs) in human dental pulp that have the potential to differentiate into adipocytes [21, 22]. Also, we have found that human dental pulp cells have the ability to differentiate into chondrocytes. Based on these results, we decided to use HDPCs in this study as our MSC-containing population of primary culture cells.
Enhancement of proliferation of HDPCs by poly(P)
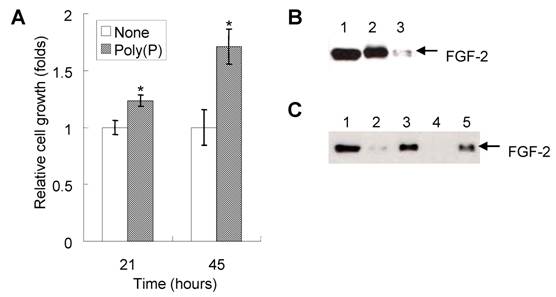
Since cell proliferation is one of the important steps for the initial phase of bone generation, we first investigated the effect of poly(P) on the proliferation of HDPCs. The addition of 1 mM poly(P) to the cell culture medium enhanced the proliferation of HDPCs up to 1.24 fold and 1.74 fold of that of non-treated cells after 21 and 45 hours of incubation, respectively (Fig. 2A).
Since it has been reported that poly(P) enhances the proliferation of fibroblasts by facilitating the autocrine functions of FGF-2 [8], we also confirmed the existence of FGF-2 on the cell surface as well as the presence of intracellular FGF-2 expressed in HDPCs. Both intracellular FGF-2 (Fig. 2B, lane 2) and cell surface receptor-bound FGF-2 (Fig. 2B, lane 3) were detected in HDPCs. Poly(P) could stabilize self-produced FGF-2, resulting in the enhancement of proliferation of HDPCs.
Furthermore, the stability of FGF-2 located at the cell surface receptors was also examined by adding purified FGF-2 (40 ng/ml) to the cell culture medium. FGF-2 was stably maintained at the cell surface in the presence of poly(P) for more than 40 hours (Fig. 2C, lane 5), whereas little FGF-2 was detected without poly(P) at the cell surface after 20 hours of incubation (Fig. 2C, lane 2). No FGF-2 was observed after 40 hours of incubation without poly(P) (Fig. 2C, lane 4). From these results, the mechanism for proliferation of the HDPCs could be explained as the result of the enhancement of FGF-2 functions by poly(P).
Multipotentiality of HDPCs isolated from human dental pulp. Isolated HDPCs were differentiated into chondrocytes (A, B, C) and adipocytes (D, E) under appropriate conditions described in Materials and Methods. (A) Differentiated chondrocytes were stained with alcian blue, and (B) the expression of aggrecan (a chondrocyte marker) was visualized by immunostaining. (C) Cell morphology of the differentiated chondrocyte was visualized by HE staining. Hypertrophic cells were observed at the peripheral area of the cell pellet. (D) Cell morphology of the differentiated adipocyte and (E) its high magnified image. Lipid accumulation was observed in the differentiated cells. Bars: 50 μm scale.
Enhancement of self-produced (autocrine) FGF function and the resultant proliferation of HDPCs by poly(P). (A) Cell proliferation after 21 and 45 hours of treatment with or without 1 mM poly(P) was measured by the MTS method. Relative cell growth was estimated by the absorbance of non-treated cells after 21 hours of incubation, which was set at 1. Open bars, relative cell growth of non-treated cells; gray bars, relative cell growth of poly(P)-treated (1 mM) cells. Significant differences between the relative cell growth rate for poly(P)-treated cells and the control cells were determined by Student's t test. Asterisk (*), p <0.01 to control (none). (B) Expression and localization of self-produced (autocrine) FGF-2 in HDPCs. Intracellular FGF-2 and cell surface receptor-bound FGF-2 were analyzed by Western blotting. Lane 1, purified recombinant human FGF-2 standard (10 ng loaded); lane 2, intracellular FGF-2 in HDPCs; lane 3, receptor-bound FGF-2 of HDPCs. (C) Stabilization of FGF-2 located at cell surface receptors. Purified FGF-2 (40 ng/ml) was added to the cell culture medium and incubated for 20 or 40 hours. Cell surface receptor-bound FGF-2 was eluted by the method described in Materials and Methods. The amount of extracted FGF-2 was estimated by Western blotting. Lane 1, purified recombinant human FGF-2 standard (10ng loaded); lane 2, receptor-bound FGF-2 of non-treated cells (20 hours after addition of FGF-2); lane 3, receptor-bound FGF-2 of poly(P)-treated cells (20 hours after addition of FGF-2); lane 4, receptor-bound FGF-2 of non-treated cells (40 hours after addition of FGF-2); lane 5, receptor-bound FGF-2 of poly(P)-treated cells (40 hours after addition of FGF-2).
Enhancement of ERK1/2 phosphorylation by poly(P)
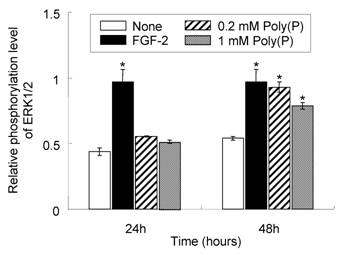
To confirm whether FGF-2 that is stabilized by poly(P) and located at the cell surface receptor is physiologically active, the phosphorylation level of mitogen-activated protein kinase (MAPK) ERK1/2, which is involved in the FGF-induced cell signaling pathway [26], was evaluated in the presence and absence of poly(P). As shown in Fig. 3, ERK1/2 phosphorylation in poly(P)-treated HDPCs was slightly enhanced after 24 hours (1.3- and 1.2-times enhanced in 0.2 and 1 mM poly(P)-treated cells, respectively, compared to that in non-treated cells), while the enhancement in FGF-2-treated cells was about 2.2-times greater than that in non-treated cells. However, after 48 hours, the phosphorylation level in poly(P)-treated (0.2 mM) cells was further increased to the almost same level as that of FGF-2-treated cells (1.7-times greater than that in non-treated cells). In 1 mM poly(P)-treated cells, ERK1/2 phosphorylation was also enhanced by about 1.5-times compared to that in non-treated cells after 48 hours of incubation. These results suggest that poly(P) activates the FGF-mediated cell signaling pathway by stabilizing FGF-2 bound at the cell surface receptors.
Elevated phosphorylation level of ERK1/2 in HDPCs treated with poly(P). Phosphorylation levels of ERK1/2 after poly(P) treatment were estimated by ELISA. Relative phosphorylation levels of ERK1/2 were estimated by dividing the amount of phosphorylated ERK1/2 by the total amount of ERK1/2. Open bars, relative phosphorylation level of ERK1/2 in non-treated cells; closed bars, level in 10 ng/ml FGF-2-treated cells; shaded bars, level in 0.2 mM poly(P)-treated cells; gray bars, level in 1 mM poly(P)-treated cells. Each value is the average of three independent assays. Significant differences between the values of poly(P)-treated cells and the control cells (None) were determined by Student's t test. Asterisk (*), p <0.01 to control (none).
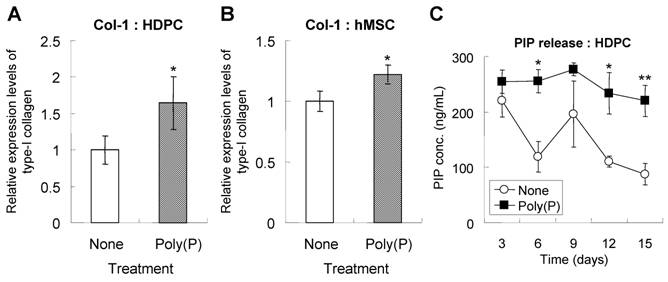
Production and maturation of type I collagen. Type-I collagen expression in HDPCs (A) and hMSCs (B). Cells were treated with or without poly(P) for 5 days, and the expression of type-I collagen was detected by immunostaining as described in Materials and Methods. Open bars, relative expression level of type-I collagen in non-treated cells; gray bars, level in 1 mM poly(P)-treated cells. Significant differences between the values of the poly(P)-treated group [Poly(P)] and the control group (None) were determined by Student's t test. Asterisk (*), p <0.01 to the control (none). (C) Expression levels of PIP in cell culture supernatants. The concentration of PIP released from HDPCs was determined by ELISA. Open circles, PIP released from cells that were not subjected to any treatment; closed squares, PIP released fromcells that were treated with 1 mM poly(P). Each value is the average ± SD of three independent experiments. Significant differences between two values (Poly(P) and None) at the same time point were determined by Student's t test. Asterisk (*), p <0.01 to control (none). Double asterisk (**), p <0.05 to control (none).
Acceleration of both expression and maturation of type-I collagen by poly(P)
During cell calcification, extracellular matrix formation is followed by cell proliferation. The extracellular matrices consist primarily of type-I collagen, the production of which is induced during bone differentiation [27]. HDPCs treated with poly(P) for 5 days expressed a larger amount of type-I collagen than did non-treated cells (Fig. 4A). The estimated expression level of type-I collagen was significantly increased in poly(P)-treated cells, being 1.7-fold higher than that in non-treated cells. Similarly, type-I collagen expression was also greatly enhanced by poly(P) in hMSCs, the level being1.2-fold higher than that in non-treated cells (Fig. 4B).
Since evaluation of collagen production by immunofluorescence is not sufficient as a quantitative analysis, more accurate analysis was performed by measuring PIP level using ELISA. The level of PIP released from HDPCs into the medium was also measured. PIP is used as a clinical index for bone turnover [28] since it is released into blood when type-I collagen has matured. Higher PIP levels indicate a higher maturation level of collagen from pro-collagen molecules. Also, higher production levels of collagen are achieved with poly(P) treatment. The high level of PIP release from HDPCs was maintained in the poly(P)-treated group, whereas the level of PIP release in non-treated cells gradually decreased as the treatment time increased (Fig. 4C). These results indicated that poly(P) continuously accelerated the production and maturation of the extracellular matrix in both cell types.
Microarray analysis of bone-related genes induced by poly(P)
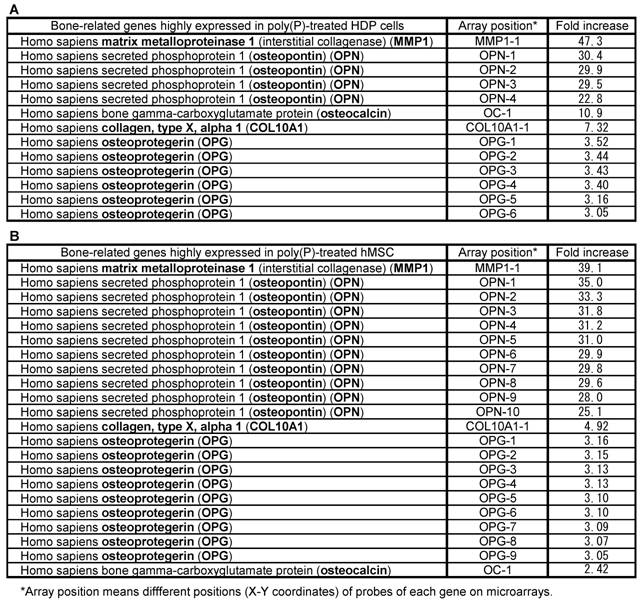
To examine the effect of poly(P) on general gene expression, especially the expression of bone-related genes, the mRNA levels of both HDPCs and hMSCs treated with poly(P) for 21 days and 23 days were compared with the mRNA levels of non-treated cells by microarray analysis (Table 1). The expression levels of matrix metalloproteinase-1 (MMP-1, interstitial collagenase) in HDPCs and hMSCs were greatly increased in poly(P)-treated cells, being 47-fold and 39-fold higher than the level in control cells, respectively. MMP-1, which is a major collagenase that catalyzes the degradation of type-I collagen into gelatin and is therefore involved in collagen turnover, is essential for bone remodeling [29]. Together with MMP-1 expression, the expressions of OPN and OC in both cell types were also induced by poly(P) treatment. A series of specific markers are expressed during cell calcification. Furthermore, a series of proteins are secreted into extracellular matrices and they play important roles in osteoblast attachment in extracellular matrices. OPN and OC are well-known osteoblast differentiation markers [30], and those osteoblast differentiation markers were also induced in MSCs during cell calcification [19]. The other bone-related genes, whose expression levels in poly(P)-treated cells were more than 3-fold higher than those in non-treated cells, included those encoding type-X collagen (7.3-fold and 4.9-fold higher levels in HDPCs and hMSCs, respectively) and osteoprotegerin (OPG) (3.33-fold and 3.11-fold higher levels in HDPCs and hMSCs, respectively).
Bone-related gene expression profile both in HDPC and hMSCs.
Real-time PCR analysis of MMP1, OPN and OC mRNA levels
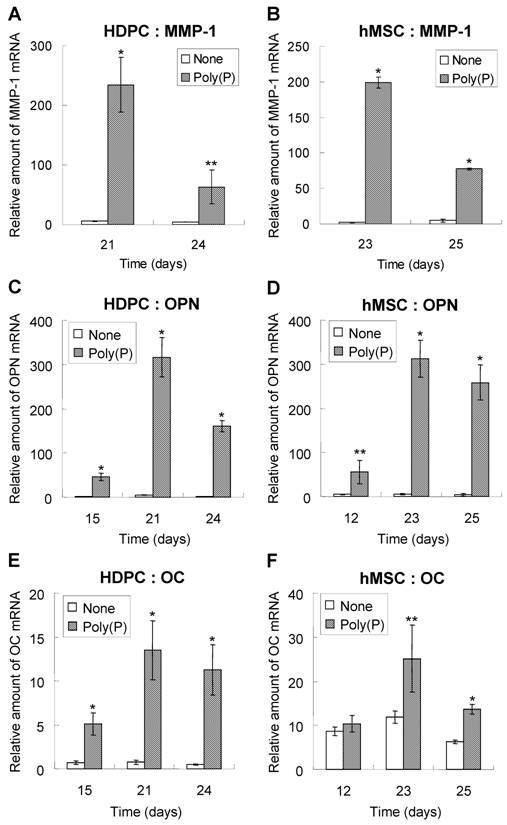
The expression levels of MMP-1, OPN and OC mRNA were confirmed by RT-PCR. As shown by microarray analysis, the expression of MMP-1 was greatly induced by poly(P). The relative expression levels were around 200-fold greater in poly(P)-treated HDPCs and hMSCs at 21 days and 23 days, respectively (Fig. 5A and 5B). As was found for MMP1, the expression of OPN mRNA was significantly induced by poly(P), and the maximum expression levels were about 72-fold higher than those in non-treated cells after 21 days of treatment in HDPCs (Fig. 5C). The expression of OC mRNA in HDPCs was also greatly induced by poly(P) (Fig.5E). Similarly, both OPN and OC expression levels were significantly increased in hMSCs by poly(P) after 23 days of treatment (Fig. 5D and 5F).
Induction of cell calcification by poly(P)
To visualize calcium deposition and cell calcification, both HDPCs and hMSCs were stained by alizarin red. As shown in Fig. 6, HDPCs and hMSCs treated with poly(P) showed visible calcium deposition after the addition of poly(P), whereas no calcification was observed in non-treated cells. The level of calcium deposition increased at 20 and 17 days after poly(P) treatment in HDPCs and hMSCs, respectively. Calcification reached a maximum level at around 34 to 24 days after the start of poly(P) treatment in HDPCs and hMSCs, respectively.
Changes in the relative mRNA levels of MMP-1, OPN and OC genes during poly(P) treatment. The mRNA levels of MMP-1 (A and B), OPN (C and D) and OC (E and F) in HDPCs (A, C and E) and hMSCs (B, D and F) were determined by quantitative real-time PCR using an ABI Prism 7000 Sequence Detection System. The sequences of the designed primers are 5'-CATCCAAGCCATATATGGACGTTCCC-3' and 5'-AGAACATCACTTCTCCCCGAATCGTAG-3' for MMP-1, 5'-CCCTGGCTGCGCTCTGT-3' and 5'-GCGCCGGAGTCTGTTCAC-3' for OC and 5'-ACTTTCACTCCAATCGTCCCTACA -3' and 5'-GGCATCAGGATACTGTTCATCAGA -3' for OPN, and the sequences of TaqMan® FAM-MGB probes are 5'-FAM-CTGACAAAGCCTTCATGTC-MGB-3' for OC and 5'-FAM-TCAAAGTCTAGGAGTTTCC-MGB-3' for OPN. The basic procedures used for quantitative PCR are described in Materials and Methods. Open bars, relative gene expression levels in non-treated cells; gray bars, levels in 1 mM poly(P)-treated cells. Relative expression levels of each genes were calculated when the expression level of day 0 was set at 1. Each value is the average ± SD of three independent experiments. Significant differences between the values of the poly(P)-treated group and control group (none) at the same time points (days) were determined by Student's t test. Asterisk (*), p <0.01 to control (none). Double asterisk (**), p <0.05 to control (none).
Acceleration of cell calcification by poly(P). Time course of calcification in HDPCs and hMSCs during poly(P) treatment. HDPCs and hMSCs were treated with 1 mM poly(P) for 34 and 24 days, respectively. Non-treated HDPCs and hMSCs (None) cultured for 34 and 24 days, respectively, were also stained with alizarin red.
4. Discussion
HDPCs isolated from human dental pulp show multipotent ability to differentiate into chondrocytes and adipocytes under appropriate conditions. Previous studies demonstrated that dental pulp contained multipotent MSCs that could differentiate into odontoblasts, adipocytes and neuronal cells [21, 22]. Our results have further shown that human dental pulp cells have the potential to differentiate into chondrocytes. This result also indicates that human dental pulp cells have the characteristics of MSCs.
Although the growth of HDPCs almost stopped in serum-free culture medium (doubling time of 64.5 hours), the mitogenic activity of HDPCs was enhanced by the addition of poly(P), increasing to a doubling time of 21.5 hours. Thus, poly(P) dramatically enhances cell proliferation in the absence of serum by accelerating cell division. Since HDPCs themselves express and secrete FGF-2, and since the secreted FGF-2 was found to be stably maintained at the cell surface for more than 40 hours in the presence of poly(P), the enhancement of HDP cell proliferation by poly(P) could result from this stabilizing effect of poly(P) on self-produced FGF-2. Our unpublished data also showed that purified FGF-2 added to culture media was stably maintained on the cell surface for up to 5 days. This is consistent with the results of our previous study showing enhancement of fibroblast proliferation by poly(P), which stabilizes FGF-2 molecules and strengthens the binding affinity between FGF-2 and its cell surface receptors [8]. With regard to the mechanism of growth stimulation by poly(P), a similar effect has also been reported by adding heparin to culture media. Heparin and heparin-like glycosaminoglycans are well-known potent modulators of FGF-1 and FGF-2, and they potentiate the mitogenic activity of both FGFs [31, 32]. Heparin sulfate stabilizes FGFs and binds to a site on the receptor and at least one site on the growth factor. Poly(P) may also facilitate FGF-2 binding to its receptors and promote signaling through the same binding sites as those of heparin sulfate, FGF-2 and its receptors since both molecules are negatively charged cellular polymers.
Phosphorylation of MAPK ERK1/2 was also induced by poly(P). This means that the FGF signaling pathway was activated by receptor-bound FGF-2, which was stabilized by poly(P). Since it took more than 24 hours for accumulation of self-produced FGF-2 that is sufficient to induce the activation of ERK1/2, only slight enhancement of the phosphorylation of ERK1/2 was observed within 24 hours; however, strong enhancement was detected 48 hours after poly(P) treatment (see Fig. 3). Also, there was no significant difference between the levels of ERK1/2 phosphorylation in 0.2 mM and 1 mM poly(P)-treated cells. This is consistent with evidence that the level of cell proliferation is almost the same when the cells are treated with 0.2 ~ 1 mM poly(P) (unpublished results). From these results, we concluded that poly(P) stabilizes FGF-2 not only physically but also functionally and that it prolongs the effect of FGF-2 on the cell.
Our results also demonstrated that not only the proliferation but also the differentiation of HDPCs was highly induced by poly(P). Formation of type-I collagen, which is the main component of the extracellular matrix, both in HDPCs and hMSCs was also induced by poly(P). This suggests that the differentiation of stem cells was accelerated by poly(P), because extracellular matrix formation is a crucial step for cell mineralization [27]. In addition, the release of PIP from HDPCs was maintained at a higher level by poly(P) treatment. Since PIP is released during the maturation step of type-I collagen [28], poly(P) plays an important role not only in enhancing collagen expression but also in accelerating collagen maturation. With regard to OPN and OC expression, an induction of sequential expression was observed in both HDPCs and hMSCs treated with poly(P). We previously reported that OPN and OC expressions were also induced by poly(P) in osteoblast-like MC3T3-E1cells, during cell mineralization [9]. Some studies have shown that hMSCs expressed these genes during mineralization, followed by the differentiation into osteoblasts and odontoblasts [21, 22]. This indicates that poly(P) is an efficient inducer of extracellular matrix formation, which is an initial step in cell calcification.
Microarray analysis showed that both HDPCs and hMSCs had a common feature in the expression of bone-related genes, including MMP1, OPN, OC, collagen type X and OPG, when treated with poly(P). The mRNA expression of MMP-1 was greatly induced by poly(P), which was reconfirmed by RT-PCR analysis. MMP-1 is a major collagenase that catalyzes the degradation of type I collagen to gelatin [29]. Since FGF-2 induces the expression of MMP-1 [14, 16, 29], this elevated mRNA level could have resulted from the enhancement of FGF-2 function by poly(P).
The induced expression of MMP-1 generally inhibits extracellular matrix formation [14]. However, poly(P) enhances both type-I collagen and MMP-1 expression, suggesting that the turnover of the extracellular matrix could be accelerated by poly(P). This is consistent with the acceleration of PIP release by poly(P). The accelerated turnover of the extracellular matrix may result from feedback regulation of accelerated collagen production.
Expressions of type-X collagen and OPG were also induced by poly(P). Type-X collagen is involved in skeletal development [33] and facilitates endochondral ossification by regulating matrix mineralization. OPG negatively regulates osteoclast differentiation by inhibiting receptor activation of NF-κB [34]. The failure of osteoclast differentiation by induced OPG expression results in the inhibition of bone absorption. The induced expressions of both type-X collagen and OPG could positively regulate cell mineralization.
The induced expression of these bone differentiation-related genes by poly(P) suggests that various regulatory networks for cell mineralization were activated even though these networks partially function to negatively regulate bone differentiation as a feedback response. Through this active stage, both positive and negative responses for cell differentiation occurred, and HDPCs and hMSCs could differentiate properly. Poly(P) could facilitate the induction of this active stage.
According to an in vivo study, FGF-2 is a potent inducer of bone regeneration as well as soft tissue regeneration [11-13]. Some in vitro studies have also shown that FGF-2 positively contributed to osteoblast cell mineralization, although the effect was exclusive and dependent on cell differentiation stage [17, 18]. Also, both the proliferation and osteogenic differentiation of MSCs are induced by FGF-2 [19]. Hanada et al. demonstrated that 6-day exposure to FGF-2 markedly stimulated cell growth and dexamethasone-dependent osteoblastic differentiation as shown by OC mRNA expression, bone nodule formation, and calcium deposition in MSCs [20]. These results are consistent with the findings in this study. It has also been reported that the activation of Cbfa1 is positively regulated by FGF-2 [35]. Since Cbfa1 is a positive regulator for cell calcification, via induction of the expression of bone-related genes such as OC, osteogenic differentiation and mineralization of MSCs were induced by FGF-2 [19, 20]. In the case of poly(P)-induced cell differentiation, the stimulation level of the FGF signaling pathway on the cells during various differentiation stages may be appropriate and close to the in vivo level. Since poly(P) only stabilizes self-produced (autocrine) FGF and prolongs its functions, the negative effect of excess amounts of exogenous FGF on cell differentiation may not be influenced. Therefore, the in vitro effect of poly(P) closely reflects the in vivo effect of FGF.
Poly(P) is a widely used material in food additives and cosmetics. Since poly(P) is a safe material with very low toxicity, it could be easy to apply for medical use as a biodegradable material. We have confirmed that poly(P) accelerates alveolar bone regeneration in rats [36]. These lines of evidence also indicate that poly(P) is a promising material for inducing dentin regeneration.
Acknowledgements
We thank Ms. A. Mizuno and Dr. K. Ooi for their technical assistance and helpful suggestions. This work was supported by a Grant-in-Aid for Creation of Innovations through the Business-Academic-Public Sector Cooperation from the Ministry of Education, Culture, Sports, Science and Technology of Japan, and a Grant-in-Aid for Development of New Technology for Industrial Application from New Energy and Industrial Technology Development Organization (NEDO). This work was also supported by Research Fellowships of the Japan Society for the Promotion of Science (JSPS) for Young Scientists (Yumi Kawazoe).
Conflict of interests
The authors have declared that no conflict of interest exists.
References
1. Kulaev IS. The biochemistry of inorganic polyphosphates, 2nd ed. New York: John Wiley & Sons, Inc.; 2004.
2. Wood HG, Clark JE. Biological aspects of inorganic polyphosphates. Ann Rev Biochem. 1988;57:235-60
3. Kornberg A. Inorganic polyphosphate: toward making a forgotten polymer unforgettable. J Bacteriol. 1995;177:491-6
4. Kulaev IS, Vogabov VM, Kulakovskaya T. New aspects of inorganic polyphosphate metabolism and function. J Biosci Bioeng. 1999;88:111-29
5. Kumble KD, Kornberg A. Inorganic polyphosphate in mammalian cells and tissues. J Biol Chem. 1995;270:5818-22
6. Ruiz FA, Lea CR, Oldfield E, Docampo R. Human platelet dense granules contain polyphosphate and are similar to acidocalcisomes of bacteria and unicellular eukaryotes. J Biol Chem. 2004;279:44250-7
7. Kornberg A, Rao NN, Ault-Riche D. Inorganic polyphosphate: a molecule of many functions. Annu Rev Biochem. 1999;68:89-125
8. Shiba T, Nishimura D, Kawazoe Y, Onodera Y, Tsutsumi K, Nakamura R. Modulation of mitogenic activity of fibroblast growth factors by inorganic polyphosphate. J Biol Chem. 2003;278:26788-92
9. Kawazoe Y, Shiba T, Nakamura R, Mizuno A, Tsutsumi K, Uematsu T, Yamaoka M, Shindoh M, Kohgo T. Induction of calcification in MC3T3-E1 cells by inorganic polyphosphate. J Dent Res. 2004;83:613-8
10. Shiba T, Takahashi Y, Uematsu T, Kawazoe Y, Ooi K, Nasu K, Itoh H, Tanaka H, Yamaoka M, Shindoh M, Kohgo T. Effect of inorganic polyphosphate on periodontal regeneration. Key Eng Mater. 2004;254:1119-22
11. Mayahara H, Ito T, Nagai H, Miyajima H, Tsukuda R, Taketomi S, Mizoguchi J, Kato K. In vivo stimulation of endosteal bone formation by basic fibroblast growth factor in rats. Growth Factors. 1993;9:73-80
12. Nakamura T, Hanada K, Tamura M, Shibanushi T, Nigi H, Tagawa M, Fukumoto S, Matsumoto T. Stimulation of endosteal bone formation by systemic injections of recombinant basic fibroblast growth factor in rats. Endocrinology. 1995;13:1276-84
13. Zellin G, Linde A. Effects of recombinant human fibroblast growth factor-2 on osteogenic cell populations during orthopic osteogenesis in vivo. Bone. 2000;26:161-8
14. Varghese S, Ramsby ML, Jeffrey JJ, Canalis E. Basic fibroblast growth factor stimulates expression of interstitial collagenase and inhibitors of metalloproteinases in rat bone cells. Endocrinology. 1995;136:2156-62
15. Canalis E, Centrella M, McCarthy T. Effects of basic fibroblast growth factor on bone formation in vitro. J Clin Invest. 1988;81:1572-77
16. Tang KT, Capparelli C, Stein JL, Stein GS, Lian JB, Huber AC, Braverman LE, DeVito LE. Acidic fibroblast growth factor inhibits osteoblast differentiation in vitro: altered expression of collagenase, cell growth-related, and mineralization-associated genes. J Cell Biochem. 1996;61:152-66
17. Debiais F, Hott M, Graulet AM, Marie PJ. The effects of fibroblast growth factor-2 on human neonatal calvaria osteoblastic cells are differentiation stage specific. J Bone Miner Res. 1998;13:645-54
18. Fakhry A, Ratisoontorn C, Vedhachalam C, Salhab I, Koyama E, Leboy P, Pacifici M, Kirschner RE, Nah HD. Effects of FGF-2/-9 in calvarial bone cell cultures: differentiation stage-dependent mitogenic effect, inverse regulation of BMP-2 and noggin, and enhancement of osteogenic potential. Bone. 2005;36:254-66
19. Tsutsumi S, Shimazu A, Miyazaki K, Pan H, Koike C, Yoshida E, Takagishi K, Kato Y. Retention of multilineage differentiation potential of mesenchymal cells during proliferation in response to FGF. Biochem Biophys Res Commun. 2001;288:413-9
20. Hanada K, Dennis JE, Caplan AI. Stimulatory effects of basic fibroblast growth factor and bone morphogenetic protein-2 on osteogenic differentiation of rat bone marrow-derived mesenchymal stem cells. J Bone Miner Res. 1997;12:1606-14
21. Gronthos S, Mankani M, Brahim J, Robey PG, Shi S. Postnatal human dental pulp stem cells (DPSCs) in vitro and in vivo. Proc Natl Acad Sci USA. 2000;97:13625-30
22. Miura M, Grohthos S, Zhao M, Lu B, Fisher LW, Robey PG, Shi S. SHED: Stem cells from human exfoliated deciduous teeth. Proc Natl Acad Sci USA. 2003;100:5807-12
23. Asahina I, Sampath TK, Nishimura I, Hauschka PV. Human osteogenic protein-1 induces both condroblastic and osteoblastic differentiation of osteoprogenitor cells derived from newborn rat calvaria. J Cell Biol. 1993;123:921-33
24. Fannon M, Nugent MA. Basic fibroblast growth factor binds its receptors, is internalized, and stimulates DNA synthesis in Balb/c3T3 cells in the absence of heparin sulfate. J Biol Chem. 1996;271:17949-56
25. Sambrook J, Fritsch EF, Maniatis T. Molecular Cloning: A Laboratory Manual. Cold Spring Harbor, NY: Cold Spring Harbor Laboratory. 1989
26. Meloche S, Seuwen K, Pagès G, Pouysseégur J. Biphasic and synergistic activation of p44mapk (ERK1) by growth factors: correlation between late phase activation and mitogenicity. Mol Endo. 1992;6:845-54
27. Hurley MM, Abreu C, Harrison JR, Lichtler AC, Raisz LG, Kream BE. Basic fibroblast growth factor inhibits type I collagen gene expression in osteoblastic MC3T3-E1 cells. J Biol Chem. 1993;268:5588-93
28. Risteli J, Elomaa I, Niemi S, Novamo A, Risteli L. Radioimmunoassay for the pyridinoline cross-linked carboxy-terminal telopeptide of type I collagen: A new serum marker of bone collagen degradation. Clin Chem. 1993;39:635-40
29. Aho S, Rouda S, Kennedy SH, Qin H, Tan EML. Regulation of human interstitial collagenase (matrix metalloproteinase-1) promoter activity by fibroblast growth factor. Eur J Biochem. 1997;247:503-10
30. Stein GS, Lian JB, Stein JL, Wijnen AJ, Montecino M. Transcriptional control of osteoblast growth and differentiation. Physiol Rev. 1996;76:593-629
31. Kwan CP, Venkataraman G, Shriver Z, Raman R, Liu D, Qi Y, Varticovski L, Sasisekharan R. Probing fibroblast growth factor dimerization and role of heparin-like glycosaminoglycans in modulating dimerization and signaling. J Biol Chem. 2001;276:23421-29
32. Chua CC, Rahimi N, Forsten-Williams K, Nugent MA. Heparan sulfate proteoglycans function as receptors for fibroblast growth factor-2 activation of extracellular signal-regulated kinases 1 and 2. Circ Res. 2004;94:316-23
33. Gerstenfeld LC, Shapiro FD. Expression of bone-specific genes by hypertrophic chondrocytes: Implications of the complex functions of the hypertrophic chondrocyte during endochondral bone development. J Cell Biochem. 1996;62:1-9
34. Indridason OS, Franzson L, Sigurdsson G. Serum osteoprotegerin and its relationship with bone mineral density and markers of bone turnover. Osteoporos Int. 2005;16:417-23
35. Xiao G, Jiang D, Gopalakrishnan R. et al. Fibroblast growth factor 2 induction of the osteocalcin gene requires MAPK activity and phosphorylation of the osteoblast transcription factor, Cbfa1/Runx2. J Biol Chem. 2002;277:36181-7
36. Hacchou Y, Uematsu T, Ueda O, Usui Y, Uematsu S, Takahashi M, Uchihashi T, Kawazoe Y, Shiba T, Kurihara S, Yamaoka M, Furusawa K. Inorganic polyphosphate: a possible stimulant of bone formation. J Dent Res. 2007;86:893-7
Author contact
![]() Correspondence to: Toshikazu Shiba: Tel: +81-42-584-8176, Fax: +81-42-595-5596. E-mail: shibacom
Correspondence to: Toshikazu Shiba: Tel: +81-42-584-8176, Fax: +81-42-595-5596. E-mail: shibacom
Received 2007-9-2
Accepted 2008-1-30
Published 2008-2-3