ISSN: 1449-2288International Journal of Biological Sciences

Int J Biol Sci 2011; 7(5):659-663. doi:10.7150/ijbs.7.659 This issue Cite
Letter
The Heparan and Heparin Metabolism Pathway is Involved in Regulation of Fatty Acid Composition
Zhihua Jiang1, ![]() , Jennifer J. Michal1, Xiao-Lin Wu2, Zengxiang Pan1, Michael D. MacNeil3
, Jennifer J. Michal1, Xiao-Lin Wu2, Zengxiang Pan1, Michael D. MacNeil3
1. Department of Animal Sciences, Washington State University, Pullman, WA 99164-6351, USA;
2. Department of Dairy Science, University of Wisconsin-Madison, Madison, WI 53706-1284, USA;
3. USDA-ARS, Fort Keogh Livestock and Range Research Laboratory, Miles City, MT 59301, USA
Abstract
Six genes involved in the heparan sulfate and heparin metabolism pathway, DSEL (dermatan sulfate epimerase-like), EXTL1 (exostoses (multiple)-like 1), HS6ST1 (heparan sulfate 6-O-sulfotransferase 1), HS6ST3 (heparan sulfate 6-O-sulfotransferase 3), NDST3 (N-deacetylase/N-sulfotransferase (heparan glucosaminyl) 3), and SULT1A1 (sulfotransferase family, cytosolic, 1A, phenol-preferring, member 1), were investigated for their associations with muscle lipid composition using cattle as a model organism. Nineteen single nucleotide polymorphisms (SNPs)/multiple nucleotide length polymorphisms (MNLPs) were identified in five of these six genes. Six of these mutations were then genotyped on 246 Wagyu x Limousin F2 animals, which were measured for 5 carcass, 6 eating quality and 8 fatty acid composition traits. Association analysis revealed that DSEL, EXTL1 and HS6ST1 significantly affected two stearoyl-CoA desaturase activity indices, the amount of conjugated linoleic acid (CLA), and the relative amount of saturated fatty acids (SFA) and monounsaturated fatty acids (MUFA) in skeletal muscle (P<0.05). In particular, HS6ST1 joined our previously reported SCD1 and UQCRC1 genes to form a three gene network for one of the stearoyl-CoA desaturase activity indices. These results provide evidence that genes involved in heparan sulfate and heparin metabolism are also involved in regulation of lipid metabolism in bovine muscle. Whether the SNPs affected heparan sulfate proteoglycan structure is unknown and warrants further investigation.
Keywords: Heparan sulfate and heparin metabolism pathway, muscle fatty acid composition, associations, genetic networks.
Research has shown that the enzymes and proteins encoded by DSEL (dermatan sulfate epimerase-like), EXTL1 (exostoses (multiple)-like 1), HS6ST1 (heparan sulfate 6-O-sulfotransferase 1), HS6ST3 (heparan sulfate 6-O-sulfotransferase 3), NDST3 (N-deacetylase/N-sulfotransferase (heparan glucosaminyl) 3), and SULT1A1 (sulfotransferase family, cytosolic, 1A, phenol-preferring, member 1), are involved in heparan sulfate and heparin metabolism [1]. Both heparan sulfate and heparin are members of the glycosaminoglycan family of carbohydrates that are very closely related in structure. As reviewed by Kolset and Salmivirta [2], cell surface heparan sulfate proteoglycans play biological roles in several aspects of lipoprotein metabolism. For example, the binding of lipoproteins to heparan sulfate presents an important process for the cellular uptake and turnover of lipoproteins. Heparan sulfate also serves as a primary interaction site for lipoprotein lipase and hepatic lipase on cell surfaces and transports lipoprotein lipase from extravascular cells to the luminal surface of the endothelia. Furthermore, Wilsie and colleagues [3] found that heparan sulfate proteoglycans facilitate fatty acid transport across the plasma membrane of adipocytes, thus contributing to intracellular lipid accumulation in the cell. On the other hand, heparin has been reported to decrease the degradation rate of lipoprotein lipase in adipocytes [4] and promote adipocyte differentiation [5]. In the present study, we tested the hypothesis that genes involved in heparan sulfate and heparin metabolism are also involved in regulation of lipid metabolism in bovine muscle.
Cattle were used as a model organism in the present study. The bovine DSEL, EXTL1, HS6ST1, HS6ST3, NDST3 and SULT1A1 genes were annotated using a protocol described previously [6]. In brief, a cDNA sequence for each of these genes was retrieved from the GenBank database and then extended to a full length cDNA sequence using electronic rapid amplification of cDNA ends (e-RACE) [7]. Next, the full-length cDNA sequence was used to search for genomic DNA contigs against the 7.15X bovine genome sequence database (see the Bovine Genome Resources at NCBI). A total of 15 primer pairs were designed to amplify various targets located in 6 genes (Table 1). Approximately 50 ng of genomic DNA from each of six Wagyu x Limousin F1 bulls were amplified in a final volume of 10 μl that contained 12.5 ng of each primer, 150 μM dNTPs, 1.5 mM MgCl2, 50 mM KCl, 20 mM Tris-HCl and 0.25 U of AmpliTaq Gold polymerase (Applied Biosystems, Branchburg, NJ). PCR conditions were as follows: 95ºC for 10 minutes, 35 cycles of 94ºC for 30 sec, 60ºC for 30 sec, and 72ºC for 30 sec, and an extension step at 72ºC for 10 min. PCR amplicons were sequenced on a capillary sequencer by High-Throughput Sequencing Solutions (Seattle, WA). A total of 19 mutations were identified in five of these six genes, including 2 single nucleotide polymorphisms (SNP) in DSEL, 1 multiple nucleotide length polymorphism (MNLP) in EXTL1, 8 SNPs in HS6ST1, 3 SNPs and 1 MNLP in HS6ST3 and 4 SNPs in NDST3, respectively (Figure S1). Based on the initial linkage disequilibrium of these mutations observed among six Wagyu x Limousin F1 bulls and their compatibility in forming multiplexes for genotyping with the Sequenom iPLEX assay design, only six mutations (see Figure S1) were genotyped on 246 F2 animals by the Genomics Center at the University of Minnesota.
Primers designed for mutation detection in six bovine genes
| Region | Primer sequences (5'-3') | Size | Tm |
|---|---|---|---|
| DSEL | |||
| Promoter | F-GGAAGCAAGACGCTCTTCATTTGT | 551 bp | 60°C |
| R-AAAGAGGAGCCCAGATGCAAAGAT | |||
| 3'UTR (I) | F-CAGCACAGTTTTTGGTGATTTGGT | 553 bp | 60°C |
| R-TTTTCTGCCAACATGAAGGGAAAT | |||
| 3'UTR (II) | F-TTCCAAACCTTAGCCGGGTATCTT | 572 bp | 60°C |
| R-AGCTGAAATCATGGGACTGCATTT | |||
| EXTL1 | |||
| Exon 1 | F- CTCACAGACAGGAGCCAATCAGAG | 584 bp | 60°C |
| R- CCTGACCTTAGCCTTGAGGGAGAG | |||
| 3'UTR (I) | F- CGTAAGAAGTATCGCAGCCTGGAG | 571 bp | 60°C |
| R- CCAGGCACGTAGCTGATGTCTATC | |||
| 3'UTR (II) | F- GCCTAATGAACTCCACGCCTACAC | 589 bp | 60°C |
| R- GCTACCACTCAGCCCACCTAGAAA | |||
| HS6ST1 | |||
| 3'UTR | F- AGTCCCTAGACTGAGGGGAGCTGT | 588 bp | 60°C |
| R- AGCGTTTGCAATGGACTGAACAT | |||
| HS6ST3 | |||
| 3'UTR (I) | F- GCTTGGATGTTCTGCTGAAACTGA | 571 bp | 60°C |
| R- AAGAGGCCTGCTCCAAATAGGAAA | |||
| 3'UTR (II) | F- AAGGAGCTGAAGGCAAAATGAGTG | 537 bp | 60°C |
| R- TCTGGACAATAACGGGTGGTTTCT | |||
| 3'UTR (III) | F- TCTCCCTTCCTGATGATTTGTTCC | 550 bp | 60°C |
| R- GGAGAGGACAAGTGTGTTGCTTCA | |||
| NDST3 | |||
| Exon 2 | F- CATTCTCCATTGCTTCACATGACC | 520 bp | 60°C |
| R- ATGGCAGACAACTCATCCCAGTTT | |||
| Exon 14 | F- CTTGTATCTCCTCCTCCCACCTCA | 538 bp | 60°C |
| R- CAGGCAAACAGCAGCCTAAAAGTC | |||
| SULT1A1 | |||
| Promoter | F- AGGCAAGAATACTGGAGTGGGTTG | 601 bp | 60°C |
| R- AGATGCCAAGAGTTCAGGTGGAAG | |||
| Exon 8 | F- AGAGGACCACAGTCAAGGAACAGG | 576 bp | 60°C |
| R- ATATGCCTCCAGAGGACCACTCAC | |||
| 3'UTR | F- CTGTTGGGAGCAAAGAACAAACCT | 507 bp | 60°C |
| R- GACTGCGTTCACACATCTCCACTT |
As described previously [8-9], 19 phenotypes were measured on these F2 animals, including 5 carcass, 6 eating quality and 8 fatty acid composition traits. Associations between genotypes and phenotypes were evaluated using linear models described previously by Daniels et al. [6]. Systematic factors in the linear models included the effects of harvest year (i=1,2,3), sex (j=1,2), sire (k=1,2,3,4,5,6), and age in days at harvest (as a covariate). The effects of markers were estimated either individually in the model or jointly in a multiple regression. In single-marker analyses, ANOVA was conducted by testing the model with the presence of marker effects ( ) vs. the model assuming null marker effects ( yi*=µ+ei ), where yi* is the phenotypic value of the i-th individual which has been adjusted for the effects of harvest years, sexes, sires, and age in days at harvest using a full model. Equivalently, this yields the null hypothesis H0 : µ1 = µ2= µ3= µ vs. the alternative Hα : {Otherwise), where µi = µ+bi is the mean of the i-th genotypes. The resulting p values were adjusted using the Bonferroni correction [10]. Briefly, let the significance level for the whole family of tests be (at most) α, then the Bonferroni correction evaluate each of the individual association tests at a significance level of α/n, where n = 6 is the number of independent tests (i.e., association tests per trait under investigation). Alternatively, a raw p value, say pi, is adjusted to be pi* =n pi. Here, we regard a family of independent tests as all the association tests made per trait, but not across traits. In the multiple regression, models representing different networks were compared based on corresponding AIC (Akaike's information criterion) values, which is a measurement of the goodness of fit of an estimated model, panelized by a function of the number of estimated parameters [11]. Given the data, several models were ranked according to their AIC values, with the best model having the lowest AIC.
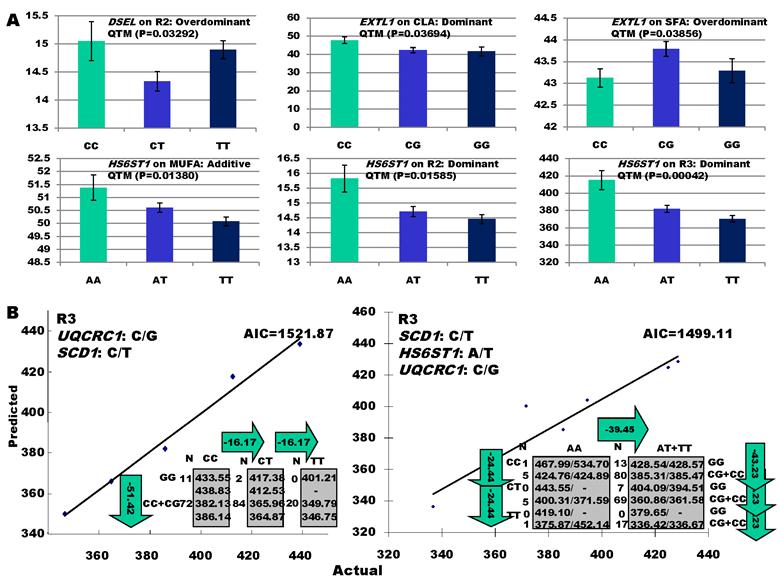
As indicated in Figure 1A, single-marker analysis revealed three genes significantly associated with five phenotypes (P<0.05), including DSEL with stearoyl-CoA desaturase activity index R2 ( calculated as (16:1/16:0) x 100%), EXTL1 with the amount of conjugated linoleic acid (CLA) and the relative amount of saturated fatty acids (SFA), and HS6ST1 stearoyl-CoA desaturase activity indices R2 (see definition described above) and R3 (calculated as (18:1/18:0) x 100%), and the relative amount of monounsaturated fatty acids (MUFA). Raw p values of these associations were also listed in the legend of Figure 1. Three genes exhibited varying quantitative trait modes (QTMs) on different phenotypes (Figure 1A). DSEL showed an overdominant effect on R2. EXTL1 also had an overdominant effect on SFA, but a dominant effect on CLA. HS6ST1 was significantly associated with R2 and R3 in a dominant QTM, while it significantly affected MUFA in an additive QTM. The p values of genetic modes were obtained from Monte Carlo simulation with 10,000 replicates. For example, over-dominance genetic mode was evaluated as Hα: { or
or  } vs. H0: {Otherwise}, where
  was the estimated effect of genotype X. Note that, when two or more markers (genes) significantly affected a trait, the effects estimated by single marker analyses were theoretically biased. So, the three markers with their QTMs on different phenotypes were then merged with other markers previously reported by Jiang et al. [9] and combined into a multiple regression analysis for each trait in attempt to identify their roles in the genetic regulation of fatty acid composition. The AIC-based model selection suggested that the addition of HS6ST1 with SCD1 and UQCRC1 formed a three-gene network for R3 (Figure 1B), because it had a smaller AIC value (which was 1499.11) than the model featuring a two-gene (UQCRC1 and SCD1) network (which was 1521.87).
We describe the associations of SNPs in genes that encode enzymes involved in heparan sulfate and heparin metabolism with fatty acid composition in bovine skeletal muscle. Heparan sulfate is a glycosaminoglycan chain that contains alternating residues of N-acetylglucosamine and uronic acid [12]. Heparan sulfate chain length and sulfation pattern affect ligand affinity and capacity. Heparan sulfate chain length is influenced by EXTL1, which encodes an α1,4-N-acetylglucosaminytransferase that is involved in heparan sulfate chain elongation [13, 14]. Sulfotransferases, such as the 6-O-sulfotransferase that is encoded by HS6ST1, catalyze sulfation of heparan sulfate. Alterations in heparan sulfate structure appear to influence lipoprotein metabolism [12]. For example, cells treated with heparinases that degrade heparan sulfate chains had impaired lipoprotein uptake [15]. Furthermore, type 2 diabetic db/db mice that exhibited postprandial dyslipoproteinemia also overexpressed heparan sulfate glucosamine 6-O-endosulfatase-2 (Sulf2), an enzyme that removes 6-O-sulfates from heparan sulfate proteoglycans [16], suggesting that specific 6-O-sulfate groups may be important in lipoprotein binding and uptake [15]. Whether the SNPs found in the bovine genes in the current study affected heparan sulfate proteoglycan structure is unknown and warrants further investigation.
Significant associations of DSEL, EXTL1 and HS6ST1 with fatty acid compositions in skeletal muscle. A: genotypic effects estimated from single marker-trait analysis. Raw P values for the six associations were 0.00549 (DSEL on R2), 0.00616 (EXTL1 on CLA), 0.00643 (EXTL1 on SFA), 0.0023 (HS6ST1 on MUFA), 0.00264 (HS6ST1 on R2), and 0.0007 (HS6ST1 on R3), respectively. B: AIC-based model selection for different gene networks.
Acknowledgements
This work was supported by Merial Ltd. Animal Genomics Research Fund to Z.J. This activity was also funded, in part, with an Emerging Research Issues Internal Competitive Grant from the Washington State University, College of Agricultural, Human, and Natural Resource Sciences, Agricultural Research Center to Z.J.
Conflict of Interests
The authors have declared that no conflict of interest exists.
References
1. Torkamani A, Topol EJ, Schork NJ. Pathway analysis of seven common diseases assessed by genome-wide association. Genomics. 2008;92:265-72
2. Kolset SO, Salmivirta M. Cell surface heparan sulfate proteoglycans and lipoprotein metabolism. Cell Mol Life Sci. 1999;56:857-70
3. Wilsie LC, Chanchani S, Navaratna D, Orlando RA. Cell surface heparan sulfate proteoglycans contribute to intracellular lipid accumulation in adipocytes. Lipids Health Dis. 2005;4:2
4. Cupp M, Bensadoun A, Melford K. Heparin decreases the degradation rate of lipoprotein lipase in adipocytes. J Biol Chem. 1987;262:6383-8
5. Luo W, Shitaye H, Friedman M. et al. Disruption of cell-matrix interactions by heparin enhances mesenchymal progenitor adipocyte differentiation. Exp Cell Res. 2008;314:3382-91
6. Daniels TF, Wu XL, Pan Z. et al. The reverse cholesterol transport pathway improves understanding of genetic networks for fat deposition and muscle growth in beef cattle. PLoS One. 2010;5:e15203
7. Jiang Z, Michal JJ, Tobey DJ. et al. Comparative understanding of UTS2 and UTS2R genes for their involvement in type 2 diabetes mellitus. Int J Biol Sci. 2008;4:96-102
8. Alexander LJ, Macneil MD, Geary TW. et al. Quantitative trait loci with additive effects on palatability and fatty acid composition of meat in a Wagyu-Limousin F2 population. Anim Genet. 2007;38:506-13
9. Jiang Z, Michal JJ, Chen J. et al. Discovery of novel genetic networks associated with 19 economically important traits in beef cattle. Int J Biol Sci. 2009;5:528-42
10. Abdi H. Bonferroni and Sidak correction for multiple comparisons. In: (ed.) Salkind NJ. Encyclopedia of Measurement and Statistics. CA: Thousand Oaks. 2007
11. Akaike H. A new look at the statistical model identification. IEEE Trans Automat Contr. 1974;19:716-723
12. Bishop JR, Stanford KI, Esko JD. Heparan sulfate proteoglycans and triglyceride-rich lipoprotein metabolism. Curr Opin Lipod. 2008;19:307-13
13. Kim BT, Kitagawa H, Tamura J. et al. Human tumor suppressor EXT gene family members EXTL1 and EXTL3 encode alpha 1,4- N-acetylglucosaminyltransferases that likely are involved in heparan sulfate/ heparin biosynthesis. Proc Natl Acad Sci U S A. 2001;98:7176-81
14. Busse M, Feta A, Presto J, Wilén M, Grønning M, Kjellén L, Kusche-Gullberg M. Contribution of EXT1, EXT2, and EXTL3 to heparan sulfate chain elongation. J Biol Chem. 2007;282:32802-10
15. Foley EM, Esko JD. Hepatic heparan sulfate proteoglycans and endocytic clearance of triglyceride-rich lipoproteins. Prog Mol Biol Transl Sci. 2010;93:213-33
16. Chen K, Liu ML, Schaffer L. et al. Type 2 diabetes in mice induces hepatic overexpression of sulfatase 2, a novel factor that suppresses uptake of remnant lipoproteins. Hepatology. 2010;52:1957-67
Figures
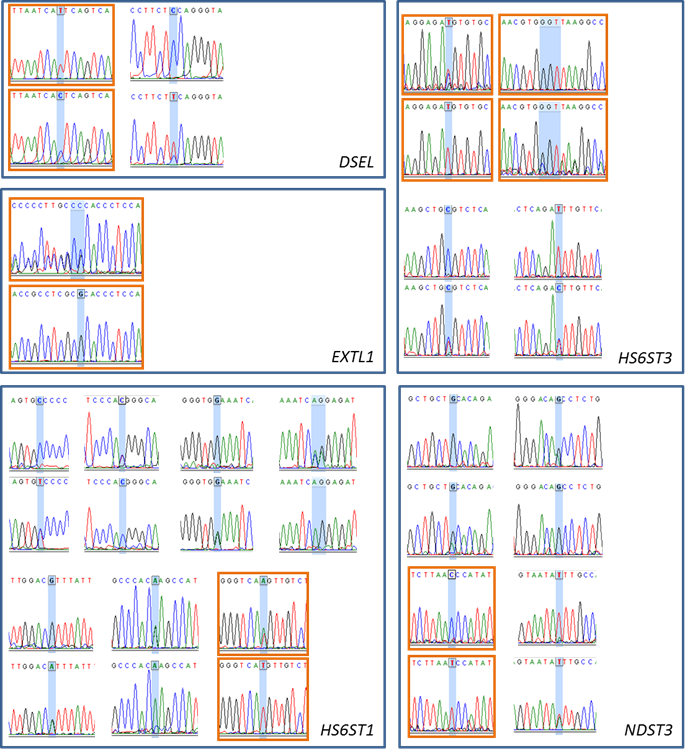
Single-nucleotide polymorphisms (SNP) or multiple-nucleotide polymorphisms (MLNP) detected in DSEL, EXTL1, HS6ST1, HS6ST3, NDST3, and SULT1A1 genes. The electropherograms highlighted in orange boxes represent the genotyped SNPs or MLNPs.
Author contact
![]() Corresponding author: Dr. Zhihua Jiang, Phone: 509-335-8761; Fax: 509-335-4246; Email: jiangzedu
Corresponding author: Dr. Zhihua Jiang, Phone: 509-335-8761; Fax: 509-335-4246; Email: jiangzedu
Received 2011-3-4
Accepted 2011-5-16
Published 2011-5-21