ISSN: 1449-2288International Journal of Biological Sciences
- Current issue
- Volume 20; 2024
- Volume 19; 2023
- Volume 18; 2022
- Volume 17; 2021
- Volume 16; 2020
- Archive
- Advance articles
- Cover images
- Index & coverage
- Cover suggestion
- Special issues
INTRODUCTION
MATERIALS AND METHODS
RESULTS AND DISCUSSION
SUPPLEMENTARY MATERIAL
Acknowledgements
References

Int J Biol Sci 2011; 7(7):992-1002. doi:10.7150/ijbs.7.992 This issue Cite
Research Paper
Identification of Candidate Genes related to Bovine Marbling using Protein-Protein Interaction Networks
Dajeong Lim1,2*, Nam-Kuk Kim1,3*, Hye-Sun Park1, Seung-Hwan Lee1, Yong-Min Cho4, Sung Jong Oh1, Tae-Hun Kim1, Heebal Kim2 ![]()
1. Division of Animal Genomics and Bioinformatics, National Institute of Animal Science, Rural Development Administration, Suwon, Republic of Korea
2. Laboratory of Bioinformatics and Population genetics, Seoul National University, Seoul, Republic of Korea
3. Gyeongnam Provincial Office, National Agricultural products Quality management Service, Busan, Republic of Korea
4. Green growth and future strategy team, Director general for planning and coordination, Rural Development Administration, Suwon, Republic of Korea
* The first two authors should be regarded as joint First Authors.
Abstract
Complex traits are determined by the combined effects of many loci and are affected by gene networks or biological pathways. Systems biology approaches have an important role in the identification of candidate genes related to complex diseases or traits at the system level. The present study systemically analyzed genes associated with bovine marbling score and identified their relationships. The candidate nodes were obtained using MedScan text-mining tools and linked by protein-protein interaction (PPI) from the Human Protein Reference Database (HPRD). To determine key node of marbling, the degree and betweenness centrality (BC) were used. The hub nodes and biological pathways of our network are consistent with the previous reports about marbling traits, and also suggest unknown candidate genes associated with intramuscular fat. Five nodes were identified as hub genes, which was consistent with the network analysis using quantitative reverse-transcription PCR (qRT-PCR). Key nodes of the PPI network have positive roles (PPARγ, C/EBPα, and RUNX1T1) and negative roles (RXRA, CAMK2A) in the development of intramuscular fat by several adipogenesis-related pathways. This study provides genetic information for identifying candidate genes for the marbling trait in bovine.
Keywords: Protein-Protein Interaction (PPI), Network, Marbling, Bovine, Hanwoo
INTRODUCTION
Marbling (intramuscular fat) is a quantitative trait that is controlled by interactions among several quantitative trait loci (QTLs) combined with environmental influences. Beef industry is looking for gene markers that would identify animals that have a high propensity to accumulate intramuscular fat in order to produce tasty and tender meat [1]. To finding the candidate genes of intramuscular fat deposition, traditional QTL analysis was used based on position dependent strategy such as thyroglobulin (TG), fatty acid binding protein 4 (FABP4), or growth hormone 1 (GH1) [2-4]. Recently, several strategies have been developed to break the restriction of information bottleneck of the traditional candidate gene approach. There are comparative functional genomics, comparative structural genomics as the next step of detection of genes of interest, function dependent strategy including signaling pathway, regulatory network [5]. Therefore, animal geneticists have attempted system-oriented approaches to investigate livestock traits [6-8], resulting in the identification and characterization of economically important causal trans-acting genes. As a result, candidate genes within these trans-QTL regions have direct or indirect interactions and share common biological functions (e.g., similar gene ontology function, metabolic pathway, transcriptional co-regulation) [9-12]. In marbling of cattle, some studies have attempted to identify candidate genes affecting phenotypic variation for marbling and tenderness using high-density microarrays based on the large-scale transcriptome level [6, 8]. Other more specific studies that selected candidates according to these molecular functions provided a better understanding of muscle physiological states and their influence on meat quality [7]. Recently, three genes, myozenin-1 (MYOZ1), titin cap protein (TCAP), and PDZ and LIM domain 3 (PDLIM3), were identified as being significantly correlated with bovine skeletal muscle based on the bovine microarray data from 47 experimental conditions using gene expression network [13]. From gene co-expression network analysis, Jiang et al. [14] reported that the genetic network was associated with 19 economically important beef traits. In our recent findings, we identified the relationship between the expression of heat shock protein β 1 (HSPB1) and its regulator genes from gene network analysis in intramuscular fat of Hanwoo (Korean cattle) [9]. Moreover, we propose that these genes were participated in mitogen-activated protein kinase (MAPK) signaling pathway and then inhibited through the MAPK-mediated phosphorylation of peroxisome proliferator-activated receptor γ (PPAR γ). These studies demonstrated that systemic approach is useful for understanding the molecular mechanisms associated with phenotypic characteristics in animals. Because analyses using model organisms have shown that direct and indirect interactions among protein pairs are responsible for similar phenotypes [15-16]. From the technical point of view, systems approaches based on gene network have leaded to the discovery of novel biology such as pathway-based biomarkers and diagnosis, systematic measurement and modeling of genetic interactions, systems biology of stem cells [17-18]. Among the systemic approaches, several studies have attempted integrate genetic networks with networks of physical interaction between proteins. In a recent review, two main classed of the network-based methods were described for predicting protein functions: direct methods such as neighborhood counting based method [19], graph theoretic methods [20], weighted function [21]. Liu et al. (2011) also used a systemic integrative approach to analysis genetic interactions extracted from gene expression and genome wide association (GWAS) data in obstructive sleep apnea (OSA) and constructed protein interaction networks [22]. The integrated analysis of mRNA expression, protein-protein interaction (PPI) network can provide a novel approach for combining data from disparate sources to identify causal genes and sub-pathways.
Here we report the result PPI network analysis of marbling-related genes and experimental evidence confirming that highly connected genes (hubs) are significantly different between high- and low-marbled groups in bovine. The object of this study is to identify candidate genes and their potential relationship in a PPI network in m.longissimus with a wide range of marbling phenotypes. The results also suggest likely biological pathways and regulatory elements of marbling-related genes.
MATERIALS AND METHODS
The analysis involved three main steps: (1) finding candidate genes associated with marbling score from the literature using the MedScan program database and PPI information to construct a PPI network related to the “marbling score” trait, (2) analyzing the network topology and functional enrichment, and (3) confirming gene expression results for hub genes using quantitative reverse-transcription PCR (qRT-PCR).
Identification of candidate genes and construction of the PPI network
To obtain a systemic view of candidate genes associated with marbling score, we searched the literature using MedScan [23] software (Ariadne Genomics, Rockville, MD, USA). The MedScan program is a natural processing language engine with data-mining algorithms that automatically extract biological information from literature in the PubMed database. To check the accuracy, we manually confirmed whether these genes are associated with the marbling trait. Additional File 1: Supplementary Data 1 presents evidence of the relationships between genes and the marbling trait from the literature. The PPI network for marbling was constructed from the proteins extracted by the data-mining algorithms. We obtained PPI between candidate proteins as links, which were determined from the Human Protein Reference Database (HPRD, Release 9 version) [24]. Although the database has been created from human protein information, we used the PPI information to construct our bovine network because the functions of proteins are closely conserved among species.
Because biological functions are carried out from stably or transiently related groups of proteins, we reasoned that interactions in potential functional relationships have higher confidence than others. We determined two types of PPI network, a core network and an extended network. We constructed a core network consisting of a set of genes as the seed genes and the connections between these genes; the genes were extracted by the MedScan text-mining algorithm. We also found additional genes that may also be involved in the network via the extended network. The extended network consisted of not only candidate proteins associated with the marbling trait but also interacting proteins. This criterion has been used to identify genes related to complex traits or diseases [25-26].
Network topology analysis
To characterize the overall network topology, we used the node degree (or connectivity), betweenness centrality (BC), edge BC, and closeness centrality (CC) [26]. The node degree is the number of connections or edges the node has to other nodes. The degree distribution of a network has a generalized power-law form p(k) ~ k-r, which is the defining property of a scale-free network [27]. The genes of nodes highly connected to nodes with few connections (hubs) play an important role as a local property in a network [28]. A node with high BC has great influence over what flows in the network. BC may play a major role as a global property since it is a useful indicator for detecting bottlenecks in a network. For node k, BC is the fraction of the number of shortest paths that pass through each node [29] and is defined as
,
Where gi→j is the number of shortest geodesic paths from node i to node j, and gi→j is the number of geodesic paths among gi→j from node i to node j that pass through node k. We calculated BC as a global property according to all nodes in a network. Edge BC is defined in the same way as BC, where an edge is central if it is included in many of the shortest paths connected to nodes. CC uses information about the average shortest distance to other nodes, which is calculated for a node as 1/average distance to all other nodes. Genes with high CC have the ability to contact any node in the network in the shortest possible path. In addition, the CC describes the connectedness of a node in undirected networks. A node that is connected by a lot of short paths to other nodes can be interpreted as relatively autonomous in opposite to all nodes that are less connected by short paths. The CC can calculate the geodesic distance of every node to every other node is computed. From the results of the network topology analysis, we selected high-degree nodes and high-centrality (BC and CC) nodes as key drivers that are most associated with our trait of interest in the network. In the simulation of attack tolerance of network, when hub nodes were attacked, the scale-free network was broken into many isolated fragments. The attack performed removing the nodes with the highest number of edges. After removing large degree nodes, we checked the change of the number of clusters and the isolated fragments.
Pathway analysis based on the Gene Ontology and Kyoto Encyclopedia of Genes and Genomes
We performed functional enrichment analysis against 1,090 genes of the extended network that were associated with marbling score enrichment in the Gene Ontology and Kyoto Encyclopedia of Genes and Genomes (KEGG) pathway terms using the Database for Annotation Visualization and Integrated Discovery (DAVID) tool (http://david.abcc.ncifcrf.gov/). The functional relationship of our genes of interest was used in the Pathway Studio software (Stratagene, La Jolla, CA, USA) [30]. We constructed gene co-annotation network based on the significant terms in the biological processes of GO using nodes of the core network. The significant GO terms identified from the DAVID tool. The p-values were computed by a modified Fisher's exact test. The genes were analyzed for overrepresented (p ≤ 0.05) categories based on Gene Ontology or KEGG data. We defined an edge as a functional linkage that is co-annotated to a Biological Process GO term (i.e., more than two genes are annotated to the GO term). We also determined the number of genes sharing the same GO terms. We also examined the effect of regulations (positive, negative, and unknown) in only the core network using Pathway Studio, because of its limited processing capacity, and constructed the biological integrated network.
Confirmation of gene expression results by qRT-PCR
We determined whether any associations existed between expression levels and intramuscular fat content in the longissimus tissue of Korean cattle (Hanwoo). Twelve steers each from a low-marbled group (9.54 ± 1.35%) and a high-marbled group (20.84 ± 1.52%) were used in this study for qRT-PCR and statistical analyses (Table 2). Total RNA was prepared from each tissue sample (100 mg) with TRIzol reagent (Invitrogen Life Technologies, Carlsbad, CA, USA) and purified using an RNeasy MinElute Clean-up Kit (Qiagen, Valencia, CA, USA). RNA concentration was measured with a NanoDrop ND-1000 spectrophotometer (Thermo Scientific, Waltham, MA, USA). RNA purity (A260/A280) was over 1.90. For cDNA synthesis, 2 µg RNA was reverse transcribed in a 20 µl reaction volume using random primers (Promega, Madison, WI, USA) and reverse transcriptase (SuperScript II Reverse Transcriptase; Invitrogen Life Technologies). Reactions were incubated at 65°C for 5 min, 42°C for 50 min, and then 70°C for 15 min to inactivate the reverse transcriptase. qRT-PCR was performed using a 2× Power SYBR Green PCR Master mix (Applied Biosystems, Foster City, CA, USA) with a 7500 Real Time PCR system (Applied Biosystems) using 10 pM of each primer. PCR was run for 2 min at 50°C and 10 min at 95°C, followed by 40 cycles at 95°C for 10 s and then 60°C for 1 min. Following amplification, a melting curve analysis was performed to verify the specificity of the reactions. The endpoint used in the qRT-PCR quantification, Ct, was defined as the PCR threshold cycle number. To determine major patterns in the gene expression data, we performed principal component analysis (PCA) for the nodes with large degree and BC. A regression model was also used to examine the association between gene expression value and intramuscular fat content using the 'lm' function in R. This produced the following equation:
IMFij = μ + Expressioni + Ageij + residualij,
where IMFij is the intramuscular fat content of each animal, μ is an overall mean, Expressioni is a normalized gene expression value, and Ageij is slaughtering age in months, which was included as a covariate; the mRNA level of the ß-actin, ribosomal protein, large, P0 (RPLP0), which are well-known as housekeeping genes, was also introduced as a covariate [31].
RESULTS AND DISCUSSION
Topology analysis of the PPI network associated with bovine marbling
We extracted 121 genes associated with marbling from MedScan results and constructed the core network composed of 69 isolated nodes and 52 nodes in eight clusters, with the largest cluster containing 21 nodes. The clustered 52 nodes were linked via 61 PPIs, corresponding to an effective mean degree of 2.34. Degree is the number of nearest neighbors of a node, and the effective mean degree is the average degree of all nodes except isolated nodes. The extended network consisted of 1,090 nodes and 1,517 edges, with a mean degree of 2.78. The network comprised 16 clusters, including a single giant cluster that contained 1,026 (94%) nodes. An overview of the core and extended PPI networks is shown in Figure 1.
Summary statistics of tissue sample for gene expression analysis
| Group | Animal | Age (month) | IMF (%) | Group | Animal | Age (month) | IMF (%) |
|---|---|---|---|---|---|---|---|
| Low | 509 | 26 | 7.11 | High | 508 | 26 | 27.97 |
| 537 | 27 | 6.02 | 582 | 31 | 18.94 | ||
| 539 | 26 | 11.56 | 603 | 31 | 18.3 | ||
| 543 | 27 | 6.6 | 648 | 29 | 20.78 | ||
| 590 | 27 | 12.6 | 652 | 29 | 17.89 | ||
| 706 | 28 | 13.37 | 685 | 29 | 21.2 |
Functional enrichment analysis using KEGG pathway terms from 121 genes in the core network.
| Pathway terms | Genes | Fold Enrichment | P-value |
|---|---|---|---|
| bta03320:PPAR signaling pathway | FABP7,FABP3,ADIPOQ,NR1H3,LPL, FABP4,FABP6,FABP5,PPARG,SCD | 13.65395 | 2.47E-08 |
| bta04080:Neuroactive ligand-receptor interaction | LEP,UTS2R,ADRB3,PRL,ADRB2,S1PR1, MC4R, ADRB1,GHR | 3.444909 | 0.00357 |
| bta04920:Adipocytokine signaling pathway | LEP,NPY,ADIPOQ,TNF,POMC | 7.260435 | 0.00441 |
| bta05216:Thyroid cancer | CTNNB1,CCND1,PPARG | 10.55556 | 0.03114 |
| bta05414:Dilated cardiomyopathy | TNF,DES,IGF1,ADRB1 | 4.752285 | 0.04892 |
The topological view of the marbling PPI network. (A) The extended PPI network (B) The core network. The circle and line indicate node and edge. The size of node indicates degree that is the number of connections or edges the node has to other nodes.The graph rendering software is Pajek program [60].
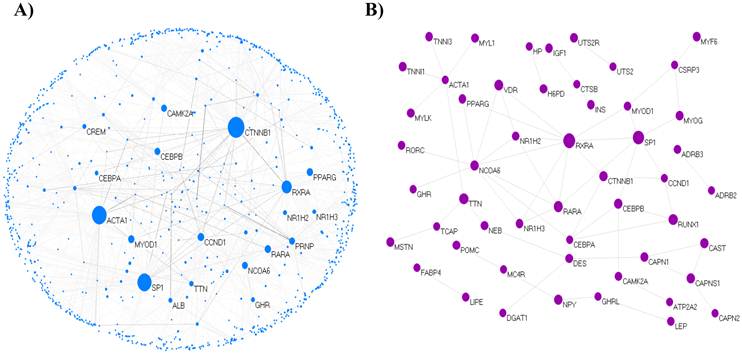
We examined whether both the core and extended networks followed a power-law distribution with an exponent using log((p(k)) and log(k), i.e., the model fitting index, R2, of the linear module that regresses log((p(k)) and log(k). This plot between log10(p(k)) and log10(k) showed that the network followed a scale-free topology. The exponent of the extended network was 3 (standard error = 0.04, R 2= 0.92) and that of the core network was 2.1 (standard error = 0.13, R 2= 0.92). The degree exponent r is usually in the range 2 ≤ r ≤ 3 in scale-free networks such as the internet, human collaboration networks, or metabolic networks [32]. Therefore, our networks have scale-free topology like the other biological networks. The core network was more fitted to the scale-free topology than the extended network. The degree-rank plot approximates power law, representing a high diversity of node degrees, with no typical node in the network for use in indicating the rest of the nodes [33]. The network transivity (clustering) can be indicated by the clustering coefficient, which is the ratio of the number of the actual connections between the neighbors of the node to the number of possible connections between them [34]. In other words, the clustering coefficient (C) determines how close the neighborhood of a node is to being part of a clique. On average, the core network had higher C (C = 0.15) than the extended network (C = 0.05). We found that the direct relationship among genes has a tight neighborhood, which provide evidence that the result can be important for predicting the biological significance of a gene. Error tolerance was examined based on the response of the scale-free network to random fragmentation [35]. To examine attack tolerance in the extended network, we removed the 10 largest degree nodes (about 1%) among all nodes. As a result, the largest cluster with 1,026 nodes broke into 405 fragments, among which the largest contained only 621 nodes.
Key nodes of the PPI network of bovine marbling
Highly connected nodes are statistically more significant in a scale-free network than in a random graph. Most biological networks are characterized by a small number of highly connected nodes, while most of the other nodes have few connections [28]. The highly connected nodes act as hubs that mediate interactions between other nodes in the network and have an important role in constructing the network. In this study, 5% of the total node set of the network was used as the critical point of high-degree and -BC nodes. Of 1,090 total nodes, 55 nodes were selected as high degree nodes. The selected key nodes are also about 5% of the largest connected cluster of network. Catenin beta 1 (CTNNB1) was the largest hub gene in the extended network. The role of CTNNB1 is induction of the MAPK Kinase (MAPKK) cascade and Wnt receptor signaling pathway through β-catenin. Beta-catenin is the 88-kDa product of the CTNNB1 gene. Wnts can inhibit adipocyte differentiation through both β-catenin-dependent and β-catenin-independent mechanisms [36]. Beta-catenin plays a major role as a transcriptional coactivator in the Wnt/β-catenin signaling pathway. CTNNB1 interacted with 135 proteins in the extended network; its linked proteins were enriched functions in adherens junctions (p = 9.7e-18), Wnt signaling pathway (p = 4.4e-9), TGF-beta signaling pathway (p = 8.4e-4), insulin signaling pathway (p = 6.3e-3), and MAPK signaling pathway (p = 3.3e-2) related to the adipogenesis. The second hub gene was actin, alpha 1 skeletal muscle (ACTA1), which is involved in muscle contraction, skeletal muscle fiber development/adaptation, and muscle thin filament assembly and is downregulated in pre-adipogenesis as a differentially expressed gene (DEG) [37]. Intramuscular fat is accumulated from perimysial connective tissue surrounding the myofiber bundles. ACTA1 interacted with 91 proteins that have statistically enriched pathway terms, such as regulation of actin cytoskeleton (p = 1.6e-5), vascular smooth muscle contraction (p = 0.012), and neurotrophin signaling pathway (p = 0.017). Neurotrophin signaling is controlled by connecting some intracellular signaling cascades, including the MAPK pathway, PI-3 kinase pathway, and Phospholipase C (PLC) pathway. It is not clear whether ACTA1 is a major factor in marbling traits, but it participated as a key node for gene-related muscle-specific adipogenesis in the network.
The BC is an indicator of a global central node. The effect of removing nodes with large BC values is similar to that of removing hub nodes because large BC nodes are correlated with hub nodes [38]. However, large BC nodes are not hub nodes; they imply that a site is relatively central between all other sites. This means that such sites are advantageously located to act as intermediaries. Therefore, we investigated communication between nodes and confirmed that hub and large-BC nodes are located in the topological center of the network by calculating the CC for the whole network. As well as hub proteins, there are five interesting protein nodes that may or may not be important in the core network, but which are large-BC nodes in the extended network: Casein kinase 2, alpha 1 polypeptide (CSNK2A1), Protein kinase C, alpha (PRKCA), Retinoblastoma 1 (RB1), V-src sarcoma (Schmidt-Ruppin A-2) viral (SRC), and Estrogen receptor alpha (ESR1) (Additional File 2: Supplementary Data 2). CSNK2A1 is involved in Wnt receptor signaling as a positive mediator and encoded casein kinase II (Ck2) with two isoforms: Ck2a and Ck2a' [39]. The Wnt signaling pathway inhibits adipogenesis by preventing the induction of the key adipogenic transcription factors, C/EBPα and proxisome proliferator-activated receptor γ (PPARγ) [40]. This possible player is involved in the connection between marbling and the adipocyte phenotype within the Wnt signaling pathway among many metabolic pathways in adipocytes that could contribute to the variation of intramuscular fat (IMF) content. PRKCA plays a role in the negative regulation of the insulin receptor signaling pathway and regulation of muscle contraction. Insulin sensitivity is associated with the accumulation of IMF and stimulates proliferation of pre-adipocytes and muscle glucose oxidation [41]. RB1 regulates lipid kinase activity and striated muscle cell differentiation and is a known tumor suppressor gene. It is upregulated in muscle differentiation with MyoD [42] as an essential factor in assisting the execution of the myogenic program [43]. SRC is known to factor in the positive regulation of the insulin receptor signaling pathway in contrast to PRKCA and interacts with genes associated with adipogenesis such as Retinoid X receptor alpha (RXRA), Adrenergic beta-2-receptor (ADRB2), and Adrenergic beta-3- receptor (ADRB3). ADRB2 has a role of positive regulation of skeletal muscle growth and activation of MAPK activity. ADRB3 is involved in positive regulation of the MAPKKK cascade. MAP kinases have an inhibitory effect on adipogenesis that can phosphorylate PPARγ and its heterodimerization partner RXR, leading to negative regulation of adipocyte differentiation [44]. ESR1 has not been reported to have any direct relationship in adipocyte cell development, although type II diabetes and atherosclerosis have been related to polymorphism of ESR1 [45-46]. Lkhagvadorj et al. [47] suggested that ESR1 may have served as a regulator to change adipocyte cell-to-cell interaction in the homeostatic mechanism in a microarray experiment. Using Pathway Studio, we also investigated which biological functions were enriched against those linked-proteins. We found that most of the connected proteins appeared to interact with the large degree nodes or nodes in the core network. In the enriched biological functions shown in this analysis, the interacted proteins were identified in multiple pathways, such as adipocytokine, insulin, and MAPK signaling. These results agree with previous findings of differentially expressed genes playing a role in the re-differentiating bovine pre-adipocytes into mature adipocytes by several biological pathways such as PPAR, insulin, adipocytokine, or MAPK signaling [48]. In particular, the functional enrichment analysis showed adipocytokine signaling to be commonly enriched. These are not central proteins in the core network or the extended network. However, they are important in communication and connection between both well-known and unknown proteins. PPARs lead to inductions of several downstream biological pathways, such as lipid metabolism, adipocyte differentiation, and gluconeogenesis. Genes with a large BC may contribute to the cooperation with the hub genes in other pathways for fat development and metabolism underlying the PPAR pathway. These genes may be useful for identifying candidate genes related to complex traits and should be investigated further.
Additional File 2: Supplementary Data 3 shows the integrated biological network between interaction partners within 121 genes, including PPI information from our analysis and the various types of regulation using Pathway Studio software. In the PPI interaction result, nuclear receptor coactivator 6 (NCOA6) was the hub gene with the largest degree in the core network and involved the following genes: VDR, RXRA, RORC, RARA, PPARγ, NR1H3, NR1H2, GHR, and C/EPBα. NCOA6, a variation of retinoic acid receptor-related orphan receptor c (RORC), is significantly associated with intramuscular fat, marbling score [49], and fatness [50]. In our results, insulin (INS) seemed to be a mediator with a large BC rather than a hub gene with a large degree in the extended and core PPI networks. However, INS had a node with the most connections within the integrated network, PPI, and regulations (Additional File 2: Supplementary Data 3). We assumed that INS may have a global impact from a topological point of view as a regulator through various biological pathways associated with the marbling trait. INS has relationships between adipogenic (fat cell) activity in the blood serum and marbling performance in beef cattle [51]. It participates in various pathways, such as positive regulation of the insulin signaling pathway, negative regulation of the fatty acids metabolic process, activation of MAPK activity, and fatty acid homeostasis. INS stimulates a wide range of mechanisms, including glucose utilization and synthesis of protein and lipid, and inhibits gluconeogenesis, proteolysis, and lipolysis
To address functional associations between gene products, we constructed a gene-co annotation network based on the significant terms in the biological processes of Gene Ontology (GO) using 121 nodes of the core network (Additional File 2: Supplementary Data 4). We defined an edge as a functional linkage that is co-annotated to a Biological Process GO term (i.e., more than two genes are annotated to the GO term). In this evaluation, the genes were skewed toward 59 biological processes. The large GO terms shared by two processes were positive regulation of biological processes (GO:0048518, p = 7.3e-13), regulation of cellular processes (GO:0050794, p = 2.3e-4), regulation of metabolic processes (GO:0019222 , p = 2.5e-7), and regulation of biological processes (p = 1.3e-5). The genes in the system with a wide range of regulation (e.g., from carbohydrates, fats, and proteins in food to energy, or other physiological processes) were thus considered to identify a number of genes that determine marbling.
Experimental validation and statistical analysis using PCA and a regression model
To further confirm gene expressions and relationships, 20 genes were selected after network topology analysis based on their degree size (≥ 25). Then qRT-PCR was performed between divergent groups, which were grouped by marbling scores. Table 3 shows gene expression results of 20 genes. The gene expression values (log2-transformed) were analyzed by regression analysis and principal component analysis (PCA). qRT-PCR showed that PPARγ, C/EBPα, RUNX1T1, RXRA, CAMK2A genes had higher expression in the high-marbled group than in the low-marbled group. Expression values of five genes (PPARγ, C/EBPα, RUNX1T1, RXRA, CAMK2A) changed two-fold between groups. The expression levels of PPARγ, RUNX1T1, and C/EBPα genes (which are involved as a transcriptional factor for adipogenesis) in the high-marbled group, were approximately 4.0, 3.8, and 3.5 times higher than in the low-marbled group, respectively.
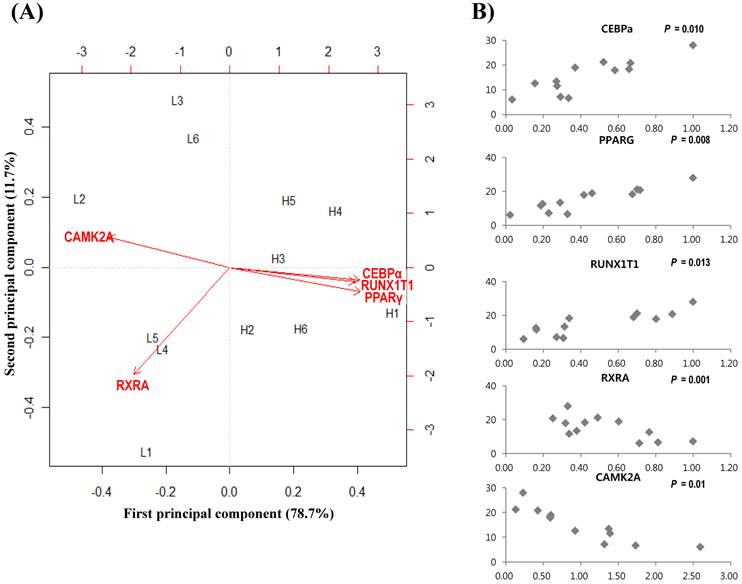
Using the R statistical package, we also conducted a linear regression analysis to examine the association between IMF contents and expression of gene level. Five genes were shown to be significant for IMF content. Of the five genes, PPARγ (p = 0.008), C/EBPα (p = 0.01), and RUNX1T1 (p = 0.013) were significantly upregulated according to IMF content increase, and RXRA (p = 0.001) and CAMK2A (p = 0.01) were negatively related to changes in IMF content (Figure 2(B)). Retinoid X receptor alpha (RXRA) is a strong suppressor of adipocyte differentiation from interaction with vitamin A [52]. Tourniaire et al. [53] reported that retinal can also be oxidized to retinoic acid (RA), the most active form of vitamin A via ligation to retinoid receptors RARs and RXRs. RA inhibits C/EBP proteins that suppress induction of downstream target genes, such as PPARγ. RXR also acts as a heterodimerization partner of PPARγ and then inhibits adipogenesis by MAP kinases. Core binding factor, runt domain, alpha subunit 2, translocated to 1 (CBFA2T1) is a protein that is encoded by the RUNX1T1 gene and is known to affect lipid metabolism in other species [54]. Its polymorphism was found to have significant association with ultrasound marbling score in beef cattle [55]. Calcium/calmodulin-dependent protein kinase II alpha (CAMK2A) contributes to myogenesis [56] and can be a candidate gene for activity-dependent skeletal muscle adaptation [57]. From our results, PPARγ and C/EBPα are the best known key regulators in the PPAR signaling pathway associated with adipogenesis and marbling trait in beef cattle [3, 58-59]. However, RXRA, CAM2KA, and RUNX1T1 have not been reported previously in bovine gene expression studies on marbling. These genes may have important roles in the biological interaction associated with the lipid and muscle metabolism in the marbling trait.
Analysis results of gene expression data by PCA and regression model. (A) Biplot of the first two principal components. The symbol of L(left) and H(right) represent low- and high-marbled samples in the plot, respectively. (B) Regression analysis between expression level (x-axis) and intramuscular fat content (%, y-axis) for each sample.
qRT-PCR results of 20 genes with high degrees in the network.
| Gene symbol | Gene description | expressiona | p-valueb | |
|---|---|---|---|---|
| Low | High | |||
| C/EBPα | CCAAT/enhancer binding protein (C/EBP), alpha | 0.23 | 0.63 | 0.0102* |
| PPARγ | proxisome proliferator-activated receptor γ | 0.21 | 0.66 | 0.0080** |
| RUNX1T1 | runt-related transcription factor 1; translocated to, 1 (cyclin D-related) | 0.22 | 0.74 | 0.0132* |
| RXRA | retinoid X receptor alpha | 0.67 | 0.40 | 0.0018** |
| CAMK2A | calcium/calmodulin-dependent protein kinase II alpha | 1.56 | 0.43 | 0.0109* |
| CTNNB1 | cadherin-associated protein beta 1 | 1.43 | 0.81 | 0.7519 |
| ACTA1 | actin, alpha 1 skeletal muscle | 1.49 | 0.87 | 0.7630 |
| SP1 | Sp1 transcription factor | 1.72 | 0.88 | 0.9625 |
| MAPK14 | mitogen-activated protein kinase 14 | 1.90 | 0.99 | 0.7780 |
| RARA | retinoic acid receptor, alpha | 1.58 | 0.85 | 0.6370 |
| C/EBPβ | CCAAT/enhancer binding protein (C/EBP), beta | 0.69 | 0.66 | 0.5725 |
| MYOD1 | myogenic differentiation 1 | 1.45 | 0.64 | 0.3458 |
| CAPN1 | calpain 1, (mu/I) large subunit | 1.17 | 1.09 | 0.0678 |
| CCND1 | cyclin D1 | 2.02 | 1.21 | 0.5590 |
| NCOA6 | nuclear receptor coactivator 6 | 1.92 | 1.30 | 0.7765 |
| FAS | Fas (TNF receptor superfamily, member 6) | 1.16 | 0.61 | 0.9459 |
| PRNP | prion protein | 1.74 | 0.96 | 0.7010 |
| VDR | vitamin D (1,25- dihydroxyvitamin D3) receptor | 2.24 | 1.59 | 0.7337 |
| RUNX1 | runt-related transcription factor 1 | 1.11 | 1.71 | 0.5674 |
| ADRB2 | adrenergic beta-2-receptor | 1.05 | 1.28 | 0.8550 |
aExpression shown as the mean of normalized expression value of each gene within low- and high-marbled group. bp-value was calculated using the regression analysis
Principal component analysis (PCA) is a useful tool for data simplification and visualization of relationships. Therefore, we applied PCA to the gene expression data set. The relationships among these genes were illustrated by principal component (PC) analyses. The first two principal components explained approximately 90.4% of the total variance, allowing most of the information to be visualized in two dimensions. Principal component analysis indicated that the most important pattern of gene expression (PC1, accounting for 78.7% of variance in the data) was associated with differences in intramuscular fat. Individual samples were clearly partitioned into two separate groups, high- and low-marbled group based on PC1. In this analysis, the first PC illustrated the link among RUNX1T1, PPARγ, and C/EBPα genes, which have a positive relationship by PC1 (Figure 2A). On the other hand, CAMK2A and RXRA genes have a negative relationship against PC1. Our experimental results suggest that these genes warrant further investigation as metabolic indicators of marbling in bovine.
In this study, we systematically examined relationships between the importance of genes and several of their topological characteristics in PPI networks. The goal of PPI study is typically to identify candidate genes associated with human diseases or phenotypes. We propose that the network analysis based on PPI information is also useful for identifying causal genes associated with economic traits of animals. This study provides information on individual protein functions and those directly associated with a functional class or process. Furthermore, candidate genes based on interaction relationships can be identified by epistatic interaction in a genome-wide study using the SNPs associated with the gene set to obtain further information regarding the physiological biology of a given trait or disease.
SUPPLEMENTARY MATERIAL
Additional File 1Supplementary Data 1. The evidence of relationship between the gene and biological function related to the marbling trait from the literature.
Supplementary Data 2. The important nodes that are not important or do not reveal in the core network, but have a large BC in the extended network.Supplementary Data 3. The integrated gene networks derived from the result of direct interactions using Pathway Studio software and PPI information of the core network.Supplementary Data 4. The gene co-annotation network of the core PPI network.
Acknowledgements
This work was supported by Agenda (200901FHT020710399) of National Institute of Animal Science, Rural Development Administration, Republic of Korea.
Conflict of Interests
The authors have declared that no conflict of interest exists.
References
1. Hocquette JF, Lehnert S, Barendse W, Cassar-Malek I, Picard B. Recent advances in cattle functional genomics and their application to beef quality. animal. 2007;1:159-173
2. Taylor JF, Coutinho LL, Herring KL, Gallagher DSJr, Brenneman RA, Burney N, Sanders JO, Turner JW, Smith SB, Miller RK. et al. Candidate gene analysis of GH1 for effects on growth and carcass composition of cattle. Anim Genet. 1998;29:194-201
3. Michal J, Zhang Z, Gaskins C, Jiang Z. The bovine fatty acid binding protein 4 gene is significantly associated with marbling and subcutaneous fat depth in Wagyu x Limousin F2 crosses. Animal Genet. 2006;37:400-402
4. Wood IA, Moser G, Burrell DL, Mengersen KL, Hetzel DJ. A meta-analytic assessment of a thyroglobulin marker for marbling in beef cattle. Genet Sel Evol. 2006;38:479-494
5. Zhu M, Zhao S. Candidate gene identification approach: progress and challenges. Int J Biol Sci. 2007;3:420-427
6. Thaller G, Kuhn C, Winter A, Ewald G, Bellmann O, Wegner J, Zuhlke H, Fries R. DGAT1, a new positional and functional candidate gene for intramuscular fat deposition in cattle. Anim Genet. 2003;34:354-357
7. Lee SH, Cho YM, Kim B, Kim N, Choy Y, Kim K, Yoon D, Im S, Oh S, Park E. Identification of marbling-related candidate genes in M. longissimus dorsi of high-and low marbled Hanwoo (Korean Native Cattle) steers. BMB rep. 2008;41:846
8. Lee SH, Gondro C, van der Werf J, Kim NK, Lim D, Park EW, Oh SJ, Gibson J, Thompson J. Use of a bovine genome array to identify new biological pathways for beef marbling in Hanwoo (Korean Cattle). BMC Genomics. 2010;11:623
9. Kim NK, Lim D, Lee SH, Cho YM, Park EW, Lee CS, Shin BS, Kim TH, Yoon D. Heat shock protein b1 and its regulator genes are negatively correlated with intramuscular fat content in the longissimus thoracis muscle of hanwoo (korean cattle) steers. J Agric Food Chem. 2011;59:5657-5664
10. Giot L, Bader JS, Brouwer C, Chaudhuri A, Kuang B, Li Y, Hao YL, Ooi CE, Godwin B, Vitols E. et al. A protein interaction map of Drosophila melanogaster. Science. 2003;302:1727-1736
11. Graugnard DE, Piantoni P, Bionaz M, Berger LL, Faulkner DB, Loor JJ. Adipogenic and energy metabolism gene networks in longissimus lumborum during rapid post-weaning growth in Angus and Angus x Simmental cattle fed high-starch or low-starch diets. BMC Genomics. 2009;10:142
12. Wang X, Xue C, Liu H, Xu Y, Zhao R, Jiang Z, Dodson MV, Chen J. Differential display of expressed genes reveals a novel function of SFRS18 in regulation of intramuscular fat deposition. Int J Biol Sci. 2009;5:28-33
13. Reverter A, Hudson NJ, Wang Y, Tan SH, Barris W, Byrne KA, McWilliam SM, Bottema CD, Kister A, Greenwood PL. et al. A gene coexpression network for bovine skeletal muscle inferred from microarray data. Physiol Genomics. 2006;28:76-83
14. Jiang Z, Michal JJ, Chen J, Daniels TF, Kunej T, Garcia MD, Gaskins CT, Busboom JR, Alexander LJ, Wright RWJr. et al. Discovery of novel genetic networks associated with 19 economically important traits in beef cattle. Int J Biol Sci. 2009;5:528-542
15. Giot L, Bader J, Brouwer C, Chaudhuri A, Kuang B, Li Y, Hao Y, Ooi C, Godwin B, Vitols E. A protein interaction map of Drosophila melanogaster. Science. 2003;302:1727
16. Gandhi T, Zhong J, Mathivanan S, Karthick L, Chandrika K, Mohan S, Sharma S, Pinkert S, Nagaraju S, Periaswamy B. Analysis of the human protein interactome and comparison with yeast, worm and fly interaction datasets. Nat Genet. 2006;38:285-293
17. Chuang HY, Hofree M, Ideker T. A decade of systems biology. Annu Rev Cell Dev Biol. 2010;26:721-744
18. Bandyopadhyay S, Kelley R, Krogan NJ, Ideker T. Functional maps of protein complexes from quantitative genetic interaction data. PLoS Comput Biol. 2008;4:e1000065
19. Chua HN, Sung WK, Wong L. Exploiting indirect neighbours and topological weight to predict protein function from protein-protein interactions. Bioinformatics. 2006;22:1623-1630
20. Nabieva E, Jim K, Agarwal A, Chazelle B, Singh M. Whole-proteome prediction of protein function via graph-theoretic analysis of interaction maps. Bioinformatics. 2005;21(Suppl 1):i302-310
21. Hu L, Huang T, Shi X, Lu WC, Cai YD, Chou KC. Predicting functions of proteins in mouse based on weighted protein-protein interaction network and protein hybrid properties. PLoS One. 2011;6:e14556
22. Liu Y, Patel S, Nibbe R, Maxwell S, Chowdhury SA, Koyuturk M, Zhu X, Larkin EK, Buxbaum SG, Punjabi NM. et al. Systems biology analyses of gene expression and genome wide association study data in obstructive sleep apnea. Pac Symp Biocomput. 2011:14-25
23. Novichkova S, Egorov S, Daraselia N. MedScan, a natural language processing engine for MEDLINE abstracts. Bioinformatics. 2003;19:1699
24. Peri S, Navarro JD, Kristiansen TZ, Amanchy R, Surendranath V, Muthusamy B, Gandhi TK, Chandrika KN, Deshpande N, Suresh S. et al. Human protein reference database as a discovery resource for proteomics. Nucleic Acids Res. 2004;32:D497-501
25. Radde N, Gebert J, Forst C. Systematic component selection for gene-network refinement. Bioinformatics. 2006;22:2674
26. Hwang S, Son SW, Kim SC, Kim YJ, Jeong H, Lee D. A protein interaction network associated with asthma. J Theor Biol. 2008;252:722-731
27. Barabasi AL, Albert R. Emergence of scaling in random networks. Science. 1999;286:509-512
28. Barabasi AL, Oltvai ZN. Network biology: understanding the cell's functional organization. Nat Rev Genet. 2004;5:101-113
29. Brandes U. A faster algorithm for betweenness centrality. J Math Soci. 2001;25:163-177
30. Nikitin A, Egorov S, Daraselia N, Mazo I. Pathway studio--the analysis and navigation of molecular networks. Bioinformatics. 2003;19:2155-2157
31. Hocquette JF, Brandstetter AM. Common practice in molecular biology may introduce statistical bias and misleading biological interpretation. J Nutr Biochem. 2002;13:370-377
32. Albert R, Barabasi A. Statistical mechanics of complex networks. Rev Mod Phys. 2002;74:47-97
33. Albert R. Scale-free networks in cell biology. J Cell Sci. 2005;118:4947-4957
34. Watts DJ, Strogatz SH. Collective dynamics of 'small-world' networks. Nature. 1998;393:440-442
35. Albert R, Jeong H, Barabasi A. Error and attack tolerance of complex networks. Nature. 2000;406:378-382
36. Li HX, Luo X, Liu RX, Yang YJ, Yang GS. Roles of Wnt/[beta]-catenin signaling in adipogenic differentiation potential of adipose-derived mesenchymal stem cells. Mol Cell Endocrinol. 2008;291:116-124
37. Lee S, Park E, Cho Y, Kim S, Lee J, Jeon J, Lee C, Im S, Oh S, Thompson J. Identification of differentially expressed genes related to intramuscular fat development in the early and late fattening stages of hanwoo steers. J Biochem Mol. 2007;40:757-764
38. Son S, Kim D, Ahn Y, Jeong H. Response network emerging from simple perturbation. J Korean Phys Soc. 2004;44:628-632
39. Kubi ski K, Doma ska K, Sajnaga E, Mazur E, Zieli ski R, Szyszka R. Yeast holoenzyme of protein kinase CK2 requires beta and beta' regulatory subunits for its activity. Mol Cell Biochem. 2007;295:229-236
40. Bennett CN, Ross SE, Longo KA, Bajnok L, Hemati N, Johnson KW, Harrison SD, MacDougald OA. Regulation of Wnt signaling during adipogenesis. J Biol Chem. 2002;277:30998-31004
41. Hausman GJ, Dodson MV, Ajuwon K, Azain M, Barnes KM, Guan LL, Jiang Z, Poulos SP, Sainz RD, Smith S. et al. Board-invited review: the biology and regulation of preadipocytes and adipocytes in meat animals. J Anim Sci. 2009;87:1218-1246
42. Martelli F, Cenciarelli C, Santarelli G, Polikar B, Felsani A, Caruso M. MyoD induces retinoblastoma gene expression during myogenic differentiation. Oncogene. 1994;9:3579-3590
43. Puri PL, Iezzi S, Stiegler P, Chen TT, Schiltz RL, Muscat GE, Giordano A, Kedes L, Wang JY, Sartorelli V. Class I histone deacetylases sequentially interact with MyoD and pRb during skeletal myogenesis. Mol Cell. 2001;8:885-897
44. Rosen ED, Spiegelman BM. Molecular regulation of adipogenesis. Annu Rev Cell Dev Biol. 2000;16:145-171
45. Gallagher CJ, Langefeld CD, Gordon CJ, Campbell JK, Mychaleckyj JC, Bryer-Ash M, Rich SS, Bowden DW, Sale MM. Association of the estrogen receptor-alpha gene with the metabolic syndrome and its component traits in African-American families: the Insulin Resistance Atherosclerosis Family Study. Diabetes. 2007;56:2135-2141
46. Huang Q, Wang TH, Lu WS, Mu PW, Yang YF, Liang WW, Li CX, Lin GP. Estrogen receptor alpha gene polymorphism associated with type 2 diabetes mellitus and the serum lipid concentration in Chinese women in Guangzhou. Chin Med J (Engl). 2006;119:1794-1801
47. Lkhagvadorj S, Qu L, Cai W, Couture OP, Barb CR, Hausman GJ, Nettleton D, Anderson LL, Dekkers JC, Tuggle CK. Microarray gene expression profiles of fasting induced changes in liver and adipose tissues of pigs expressing the melanocortin-4 receptor D298N variant. Physiol Genomics. 2009;38:98-111
48. Taniguchi M, Guan LL, Zhang B, Dodson MV, Okine E, Moore SS. Gene expression patterns of bovine perimuscular preadipocytes during adipogenesis. Biochem Biophys Res Commun. 2008;366:346-351
49. Barendse W, Bunch R, Harrison B. The effect of variation at the retinoic acid receptor-related orphan receptor C gene on intramuscular fat percent and marbling score in Australian cattle. J Anim Sci. 2010;88:47
50. Barendse W, Bunch R, Kijas J, Thomas M. The effect of genetic variation of the retinoic acid receptor-related orphan receptor C gene on fatness in cattle. Genetics. 2007;175:843
51. Miller M, Cross H, Lunt D, Smith S. Lipogenesis in acute and 48-hour cultures of bovine intramuscular and subcutaneous adipose tissue explants. J Anim Sci. 1991;69:162
52. Tourniaire F, Gouranton E, Von Lintig J, Keijer J, Luisa Bonet M, Amengual J, Lietz G, Landrier J. B-Carotene conversion products and their effects on adipose tissue. Gene Nutr. 2009;4:179-187
53. Solomon C, White JH, Kremer R. Mitogen-activated protein kinase inhibits 1,25-dihydroxyvitamin D3-dependent signal transduction by phosphorylating human retinoid X receptor alpha. J Clin Invest. 1999;103:1729-1735
54. Wolford JK, Bogardus C, Prochazka M. Polymorphism in the 3' Untranslated Region ofMTG8Is Associated with Obesity in Pima Indian Males. Biochem Biophys Res Commun. 1998;246:624-626
55. Marques E, Nkrumah JD, Sherman EL, Moore SS. Polymorphisms in positional candidate genes on BTA14 and BTA26 affect carcass quality in beef cattle. J Anim Sci. 2009;87:2475-2484
56. Kong I, Koh S, Bayguinov O, Sanders K. Small conductance Ca2+-activated K+ channels are regulated by Ca2+-calmodulin-dependent protein kinase II in murine colonic myocytes. J Physiol. 2000;524:331
57. Chin E. The role of calcium and calcium/calmodulin-dependent kinases in skeletal muscle plasticity and mitochondrial biogenesis. Proc Nutr Soc. 2007;63:279-286
58. Zhao YM, Basu U, Dodson MV, Basarb JA, Guan le L. Proteome differences associated with fat accumulation in bovine subcutaneous adipose tissues. Proteome Sci. 2010;8:14
59. SAKOYAMA R, TANIGUCHI Y, KITAGAWA M, YAMADA T, SASAKI Y. Comparison of Age-dependent Expression Patterns of C/EBP family and PPAR. GAMMA. in Musculus longissimus between Japanese Black and Holstein Breeds. Nihon Chikusan Gakkaiho. 2004;75:527-533
60. Vitevitch MS. What can graph theory tell us about word learning and lexical retrieval?. J Speech Lang Hear Res. 2008;51:408-422
Author contact
![]() Corresponding author: Heebal Kim, PhD, Department of Food and Animal Biotechnology, Seoul National University (SNU), Seoul, 151-742, Republic of Korea. Email: heebalac.kr; Phone: +82 2 880 4803; Fax: +82 2 873 2271.
Corresponding author: Heebal Kim, PhD, Department of Food and Animal Biotechnology, Seoul National University (SNU), Seoul, 151-742, Republic of Korea. Email: heebalac.kr; Phone: +82 2 880 4803; Fax: +82 2 873 2271.
Received 2011-4-28
Accepted 2011-8-8
Published 2011-8-13