ISSN: 1449-2288International Journal of Biological Sciences
- Current issue
- Volume 20; 2024
- Volume 19; 2023
- Volume 18; 2022
- Volume 17; 2021
- Volume 16; 2020
- Archive
- Advance articles
- Cover images
- Index & coverage
- Cover suggestion
- Special issues
Introduction
Materials and Methods
Results
Discussion
Supplementary Material
List of Abbreviations
Acknowledgements
References

Int J Biol Sci 2012; 8(1):15-29. doi:10.7150/ijbs.8.15 This issue Cite
Research Paper
Influence of Five Potential Anticancer Drugs on Wnt Pathway and Cell Survival in Human Biliary Tract Cancer Cells
Julia WACHTER1, Daniel NEUREITER2, Beate ALINGER2, Martin PICHLER3, Julia FUEREDER1, Christian OBERDANNER4, Pietro Di FAZIO5, Matthias OCKER5, Frieder BERR1, Tobias KIESSLICH1, 2 ![]()
1. Department of Internal Medicine I, Paracelsus Medical University / Salzburger Landeskliniken (SALK), Muellner Hauptstrasse 48, 5020 Salzburg, Austria.
2. Institute of Pathology, Paracelsus Medical University / Salzburger Landeskliniken (SALK), Muellner Hauptstrasse 48, 5020 Salzburg, Austria.
3. Division of Oncology, Department of Internal Medicine, Medical University of Graz, Auenbruggerplatz 15, 8036 Graz, Austria.
4. Tecan Austria, Untersbergstrasse 1, 5082 Grödig, Austria.
5. Institute for Surgical Research, Philipps-University Marburg, Baldingerstrasse, 35033 Marburg, Germany.
Abstract
Background: The role of Wnt signalling in carcinogenesis suggests compounds targeting this pathway as potential anti-cancer drugs. Several studies report activation of Wnt signalling in biliary tract cancer (BTC) thus rendering Wnt inhibitory drugs as potential candidates for targeted therapy of this highly chemoresistant disease.
Methods: In this study we analysed five compounds with suggested inhibitory effects on Wnt signalling (DMAT, FH535, myricetin, quercetin, and TBB) for their cytotoxic efficiency, mode of cell death, time- and cell line-dependent characteristics as well as their effects on Wnt pathway activity in nine different BTC cell lines.
Results: Exposure of cancer cells to different concentrations of the compounds results in a clear dose-dependent reduction of viability for all drugs in the order FH535 > DMAT > TBB > myricetin > quercetin. The first three substances show high cytotoxicity in all tested cell lines, cause a direct cytotoxic effect by induction of apoptosis and inhibit pathway-specific signal transduction in a Wnt transcription factor reporter activity assay. Selected target genes such as growth-promoting cyclin D1 and the cell cycle progression inhibitor p27 are down- and up-regulated after treatment, respectively.
Conclusions: Taken together, these data demonstrate that the small molecular weight inhibitors DMAT, F535 and TBB have a considerable cytotoxic and possibly Wnt-specific effect on BTC cell lines in vitro. Further in vivo investigation of these drugs as well as of new Wnt inhibitors may provide a promising approach for targeted therapy of this difficult-to-treat tumour.
Keywords: Biliary Tract Cancer, Wnt pathway, pharmacological inhibition, Cytotoxicity, Apoptosis
Introduction
The Wnt pathway represents a conserved cellular signalling mechanism involved in various steps of embryonic development and stem cell regulation [1, 2]. A broad range of functional studies revealed that this pathway also contributes to malignant behaviour by augmenting tumour cell proliferation [3], anti-apoptosis signalling [4], and invasion by promoting epithelial-to-mesenchymal transition [5]. Furthermore, survival and maintenance of highly tumourigenic cancer stem or cancer-initiating cell subpopulations have been linked to active Wnt signalling in analogy to their physiologic stem cell counterpart [6]. Therefore, inhibition of Wnt signalling pathway represents an attractive therapeutic target for many human cancer types [7].
The prognosis of patients with biliary tract cancer (BTC) is still poor due to limited therapeutic options [8]. A recently published phase III randomised trial proved a moderate benefit of cisplatin plus gemcitabine chemotherapy in advanced BTC (median 11.7 months overall survival compared to 8.1 months of the gemcitabine standard arm) [9]. Photodynamic therapy is established for local treatment of advanced hilar BTCs [10]. Nevertheless, identification of molecular oncogenic mechanisms amenable to targeted therapy is highly needed for this tumour type to more significantly improve the patient's prognosis [11].
Canonical Wnt signal transduction is based on paracrine signals by Wnt ligands (19 members) which are registered at the receiving cell by plasma membrane receptors (frizzled receptors and low density lipoprotein receptor-related protein, LRP) resulting in stabilisation of cytoplasmatic β-catenin proteins and its subsequent nuclear translocation and transcription regulation by interaction with members of the TCF/LEF family (T-cell specific transcription factor, lymphoid-enhancer binding factor 1). In absence of Wnt ligands, β-catenin is degraded by the cytoplasmatic destruction complex consisting of multiple proteins such as APC (adenomatous polyposis coli), axin2, casein kinase-2 (CK2) and GSK3β (glycogen synthase kinase 3β) [12, 13]. In a recent study we reported correlation of active Wnt signalling as indicated by cytoplasmatic and nuclear localisation of the Wnt effector protein β-catenin with cellular proliferation (cyclin-D1 and Ki67 expression) both in vitro and in vivo in human BTC [14].
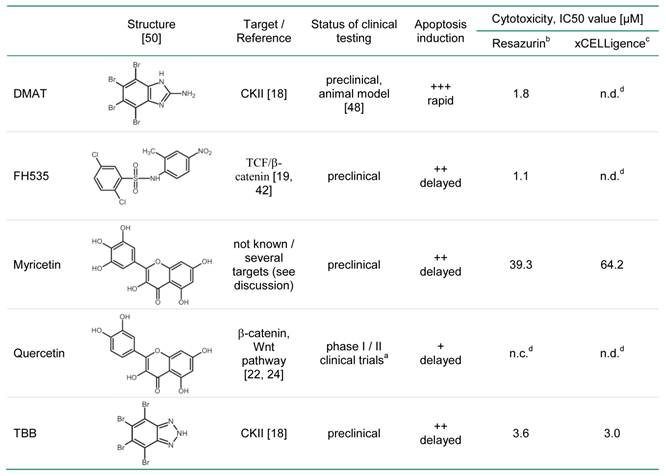
Based on these findings, and other reported alterations of Wnt / β-catenin signalling in BTC [15-17] this study analysed the cytotoxic efficiency and cellular mechanisms of several small molecular weight drugs with suggested inhibitory effects on Wnt signalling in nine different BTC cell lines. The inhibitors DMAT (2-dimethylamino-4,5,6,7-tetrabromo-1H-benzimidazole; CK2 inhibitor [18]), FH535 (dual PPAR and β-catenin inibitor [19]), myricetin and quercetin (flavonoids), and TBB (4,5,6,7-tetrabromo-2-azabenzimidazole, CK2 inhibitor) were tested for their dose- and cell line-dependent cytotoxic effects on BTC cells in vitro. The compounds were chosen either i) referring to their ability to inhibit casein kinase II (DMAT, TBB) which is required for active Wnt signalling [20, 21], or ii) because of a reported inhibitory effect on β-catenin / TCF-mediated transcription (FH535 [19], quercetin and myricetin [22-24]). Apoptosis detection by caspase activation and nuclear fragmentation, time-dependent cytotoxicity and cell cycle analysis were used to investigate the cellular mechanisms of toxicity. Furthermore, specific effects on Wnt signal transduction and expression of Wnt pathway targets were analysed by reporter gene assays and target mRNA / protein quantification, respectively. In brief, the results indicate differential effects of these inhibitors on proliferation and direct cytotoxic effects by apoptosis induction in BTC cells. The results suggest that DMAT, FH535, and TBB show considerable cytotoxicity in our BTC in vitro model system which might partly rely on their ability to inhibit Wnt signal transduction. Subsequent preclinical testing of these drugs seems promising while elucidation of the specific mode of action and pathway specificity requires additional in-depth analyses.
Materials and Methods
Substances and cell culture
Resazurin sodium salt, propidium iodide, RNAse and the Wnt pathway inhibitors (DMAT, FH535, Myricetin, Quercetin, and TBB) were obtained from Sigma-Aldrich (Vienna, Austria). Biliary tract cancer cell lines included CCLP-1(G3, original tumour grading), CCSW-1(G2), BDC(G4), Egi-1(G3), SkChA-1(G3), TFK-1(G2), derived from bile duct carcinoma and MzChA-1(G1), MzChA-2(G2), GBC(G1), derived from gallbladder cancer (see [14] for references) and were cultured as described previously [14, 25] in Dulbecco's modified Eagle's medium (DMEM) supplemented with 10% (v/v) foetal bovine serum (FBS; PAA Laboratories, Pasching, Austria). For incubation with Wnt inhibitors, serum-free DMEM (sfDMEM) was used to avoid interactions between serum components and the compounds. For all experimental setups in different cell culture receptacles, cells within 10 passages were seeded at cell densities of 3.68*104 cm-2 (for CCLP-1, BDC, MzChA-2), 4.41*104 cm-2 (for CCSW-1, GBC), 5.15*104 cm-2 (for SkChA-1), 5.88*104 cm-2 (for Egi-1, TFK-1), and 6.62*104 cm-2 (for MzChA-1) in 10% FBS DMEM.
Viability analysis
Dose-dependent cytotoxicity was measured using CCLP-1 cells in 96-well microplates using the resazurin assay as described previously [25]. This test involves incubation of cells with the blue, weakly fluorescent resazurin which is converted to the pink, highly fluorescent resorufin catalysed by cellular dehydrogenase enzymes and cytochromes. Therefore, the rate of dye reduction monitored by the change in fluorescence reflects the number of viable cells in a sample [26]. Twenty-four hrs after seeding, the cells were washed once with sfDMEM and incubated with a serial dilution of the respective inhibitor in sfDMEM for 72 hrs. Afterwards, the cellular viability signal was measured using the resazurin assay as described previously [25] using an Infinite M200 microplate reader at λEX=535 nm / λEM=588 nm (Tecan, Groedig, Austria). Similarly, cytotoxicity of a constant concentration of each inhibitor (10 µM for DMAT and TBB, 20 µM for FH535, and 50 µM for Myricetin and Quercetin) was measured for all BTC cell lines and related to untreated control cells (100% viability). For analysis of the kinetics of the viability signal, CCLP-1 cells were treated and processed in 96-well microplates using the resazurin assay as described above at 0, 24, 48, and 72 hrs post incubation. All values are related to the initial value of each treatment (or control, i.e. 100% or '1' in Figure 3 A, B).
Real-time cell viability analysis
The xCELLigence system (Roche Applied Science, Mannheim Germany) was used for real-time and time-dependent analysis of the cellular response of CCLP-1 cells (Fig. 3 C, D). Using specifically designed microplates, this system measures the cellular impedance which is dependent on the level of cell confluence and is defined as (Rn-Rb)/(15Ω), where Rn is the cell-electrode impedance of the well containing cells and Rb is the background impedance of the well with medium alone. This value is expressed by the cell index which itself reflects the number of cells attached to and spreading on the bottom of the microplate wells. Changes in the cell index, therefore, mirror the number of viable cells as apoptotic cells round up and loose contact to the substrate [27]. In brief, 7200 cells per well were seeded in 96-well E-plates (Roche Applied Science; in 150 µl 10% FBS DMEM), washed once with 150 µl sfDMEM after 24 hrs and incubated with four different concentrations of TBB and myricetin. The cell index was calculated relative to untreated control cells set at 100%. Values were normalised to the time point of treatment and continuously measured every 15 s (0-6 hrs), 60 s (6-18 hrs) or every 15 min (18-72 hrs). For better readability error bars are shown only for the 65th (within 0-6 hrs), 25th (6-18 hrs) and 4th (18.5-72 hrs) data point. Data analysis was performed using the RTCA software 1.2.1 (Roche) for calculating the temporal dynamics of cell index changes and IC50 values of each drug.
Apoptosis detection
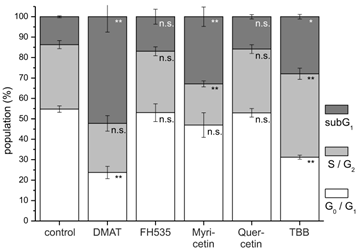
Measurement of caspase-3/7 activity was performed at 0, 10, 24, and 32 hrs post incubation using the luminometric Caspase-Glo 3/7 Assay (Promega, Mannheim, Germany) and the Infinite M200 reader according to the manufacturer's instructions and related to the total protein content (bicinchoninic acid assay; Thermo Scientific, Vienna, Austria) to normalise for variations in the cell number (Fig. 4 A, B). Cell cycle analysis (Fig. 5) was performed with ethanol-fixed, RNase-treated and propidium iodide-stained cells following 48 hrs after incubation with each inhibitor using a Dako Galaxy flow cytometer (Dako, Glostrup, Denmark) and analysed using Partec's FloMax software (Partec, Görlitz, Germany). Furthermore, cells were analysed 24 hrs after treatment by phase contrast microscopy (Fig. 4E) and fluorescence microscopy (Fig. 4F) following nuclear staining with Hoechst 33342 (5 µg/ml for 15 min at 37°C) using an IX70 inverted fluorescence microscope (Olympus, Vienna, Austria) equipped with a DFC425 C digital camera (Leica Mikrosysteme, Vienna, Austria).
Effect of Wnt inhibitors on specific Wnt reporter transcription
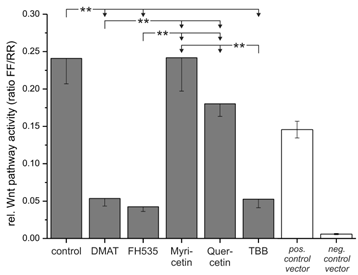
Using the Cignal reporter assay kit (SABiosciences, Frederick, MD, USA), the inhibitory effect of each compound on the expression of a luciferase reporter gene under the control of TCF/LEF transcriptional response element was investigated in CCLP cells. In brief, cells were transfected with the reporter or control constructs and then exposed to the inhibitory substances for 6 hrs. Afterwards cells were lysed and measured using the Dual Luciferase Reporter assay (Promega) in the therefor certified Infinite M-200 reader. The two luminescence values obtained after injection of the respective substrates indicate the specific reporter signal (firefly luciferase, 'FF') and the internal control signal (renilla luciferase, 'RR') expressed as ratios (FF/RR) to correct for variations in transfection efficiency or cell number.
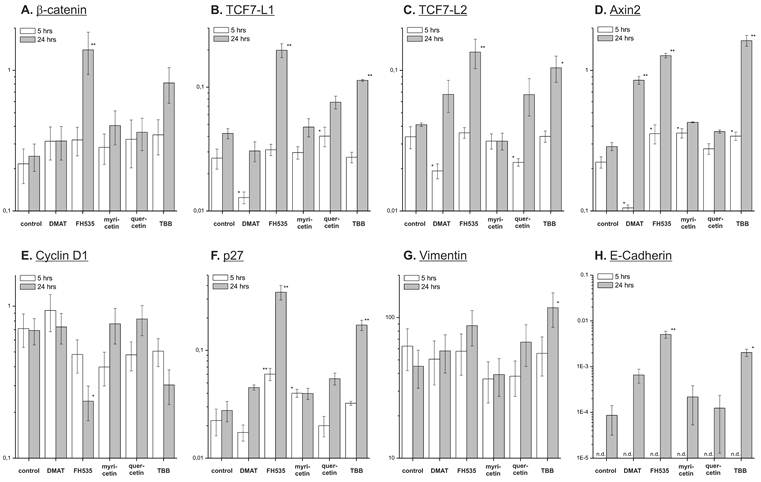
Real-time reverse transcription PCR of Wnt pathway targets
Cells were seeded in 6 cm culture dishes and treated with single concentrations of the inhibitors and lysed after 5 or 24 hrs by addition of Trizol reagent (Invitrogen, Lofer, Austria). Total RNA was isolated, purified by RNase-free DNase (Promega, Mannheim, Germany) and reverse transcribed using the ImProm-II RT system (Promega) with random primers (Invitrogen), all according to the manufacturer's instructions. Quantitative real-time reverse transcriptase-PCR (qRT-PCR) was employed to analyse expression of Wnt target genes (cyclin D1, p27, vimentin, E-Cadherin, β-catenin, axin2, TCF7L1, and TCF7L2) using the ViiA 7 real-time PCR thermocylcer (Applied Biosystems, Vienna Austria). Identity and specificity of the product was checked by agarose gel-electrophoresis and by negative first-deviation plots of the melting curve, respectively. Calculation of the relative expression of each transcript (X) was performed using the formula 2-ΔCt [14, 28], where ΔCt=Ct(x)-Ct(housekeeping gene) with β-actin as the housekeeping gene. For primer sequences see Supplementary Material: Table S1.
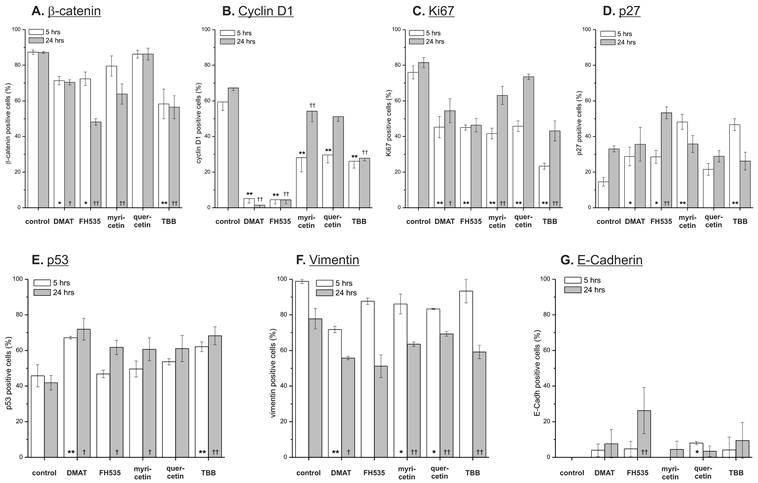
Immunochemistry on Wnt pathway targets
For semi-quantitative analysis of changes in target protein expression after pathway inhibition, CCLP-1 cells were seeded in 10 cm diameter Petri dishes and - after an overnight incubation step - exposed to the individual inhibitors for 5 or 24 hrs in sfDMEM. Subsequent preparation of cell blocks after inhibitor exposure, basic histology and immunochemistry were performed as described recently [14]. From paraffin-embedded cell blocks, cylindrical 3 mm diameter cores were obtained, arranged in an array-like pattern and again embedded in paraffin. Five µm sections from these arrays were stained for β-catenin, cyclin D1, Ki67, p27, p53, E-Cadherin, and vimentin as described previously [14] and images were assessed independently by two experienced investigators (TK and DN). See Supplementary Material: Table S2 for details on antibodies and procedures.
Statistics
All data represent mean values of at least three independent experiments ± SEM (standard error of mean). Correlation analysis was performed by comparison of the efficiencies of the inhibitors with cellular characteristics (proliferation and differentiation markers) according to Pearson using PASW Statistics 18.0.2 (SPSS GmbH Software, Munich, Germany). Paired t-test was used for calculation of differences between treated and untreated samples for dose- (Fig. 1) and cell line-dependent cytotoxicity (Fig. 2). Univariate ANOVA and the LSD (least significant difference) post hoc test were used for comparison between controls and treated cells for apoptosis induction (Fig. 4), cell cycle distribution (Fig. 5), Wnt reporter gene activity (Fig. 6), and target gene expression analysis (Fig. 7, 8). For all calculations, p<0.05 and p<0.01 was considered as significant or highly significant, respectively.
Results
Dose-dependent cytotoxicity
For investigation of the dose-dependent effect of the drugs, the CCLP-1 cell line that showed considerable cytotoxic effects for all inhibitors, was incubated with varying concentrations of each inhibitor for 72 hrs. All substances are dissolved in DMSO which shows no cytotoxicity in all cell lines at the concentrations used as determined in preceding control experiments (as solvent alone, data not shown). As shown in Figure 1, the drugs DMAT, FH525 and TBB (Fig. 1A) cause a clear dose-dependent reduction in cell viability compared to untreated control cells resulting in a viability signal <10-20% at concentrations of 10, 5, and 2 µM for TBB, DMAT and FH535, respectively.
Dose-dependent cytotoxicity. CCLP-1 cells were incubated with increasing concentrations of DMAT, FH535, TBB (A) or myricetin, quercetin (B) in serum-free DMEM. After 72 hrs incubation at 37° C, the viability was measured using the resazurin assay and related to untreated controls (set to 100%). Significant (p<0.05) and highly significant (p<0.01) differences between the viability signal of treated cells and the untreated controls are marked with *, †, § and **, ††, §§, respectively (paired t-test).
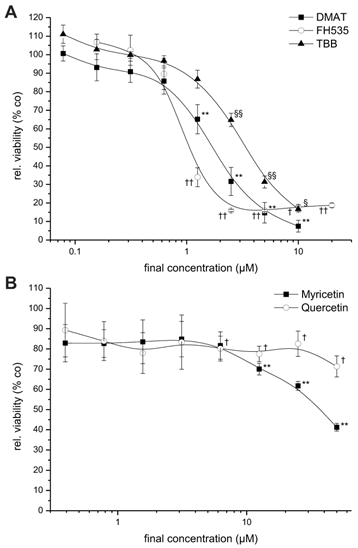
For myricetin and quercetin (Fig. 1B), the cytotoxic effect is much less pronounced, since a significant reduction to about 40 or 70% of controls can be obtained only at the highest concentrations (50 µM) of myricetin and quercetin, respectively. The IC50 values of each drug are estimated by linear interpolation from Fig. 1A, B indicating the order of cytotoxic efficiency as FH535 (1.1 µM) > DMAT (1.8 µM) > TBB (3.6 µM), > myricetin (39.3 µM) > quercetin (not determinable); see also Table 2 below.
Cell line-dependent cytotoxicity
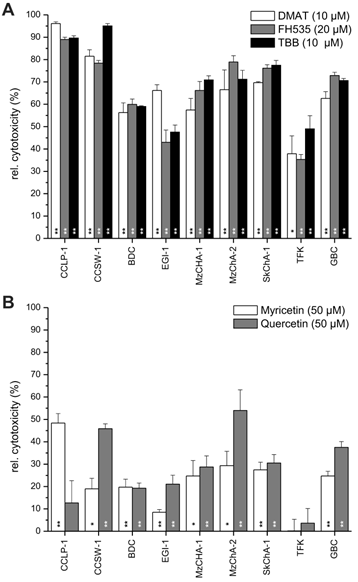
Constant concentrations of each inhibitor (10 µM for DMAT and TBB, 20 µM for FH535, and 50 µM for myricetin and quercetin) were applied to nine different BTC cell lines for 72 hrs followed by measurement of the cytotoxicity relative to untreated controls (set to 0% toxicity) for each cell line. Figure 2A shows high toxicity of DMAT, FH535 and TBB of up to 90% cell killing in CCLP-1 and CCSW-1 cells, followed by 60-70% cytotoxicity in MzChA-1, MzChA-2, SkChA-1 and GBC cells whereas lower levels of overall toxicity (35-50%) were found for BDC, EGI-1 and TFK cells. As expected from the results of Fig.1, overall toxicity of myricetin and quercetin is much lower in the range of 20-30% for most cell lines (Fig. 2B) with some exceptions where up to 50% cytotoxicity are obtained for some cell line-drug combinations (e.g. myricetin in CCLP-1 and quercetin in CCSW-1, MzChA-2 and GBC cells).
Relation of cytotoxicity to cellular phenotype
Correlation analysis was used to relate the findings of Fig. 2 to general parameters of the cellular phenotype such as differentiation and proliferation markers. As shown in Table 1, there is positive correlation between the cytotoxicity of the individual inhibitors in the nine BTC cell lines. Cytoplasmatic or nuclear localisation of β-catenin as an indicator of active Wnt signalling [12, 29] shows a constant positive and in part significant correlation with the drug's cytotoxicity. In contrast, membranous β-catenin localisation negatively correlates with the cytotoxic effect exerted by each of the inhibitors. Comparison with markers of cellular differentiation such as cytokeratin and E-Cadherin expression indicates a constant negative correlation with the cytotoxicity of the inhibitors. Especially for mRNA or protein levels of Ck7, Ck8, Ck19 and E-Cadherin the negative association with the cytotoxic effect of individual inhibitors is (in part highly) significant.
Overall cell line-dependent cytotoxicity. Nine different biliary tract cancer cell lines were incubated with a single concentration of DMAT, FH535, TBB (A) or myricetin, quercetin (B) as indicated in the diagram in serum-free DMEM for 72 hrs at 37° C. Afterwards, the resazurin assay was used to determine the cytotoxic effect (i.e. loss of viability) compared to untreated controls for each cell line (set to 0% toxicity). Significant (p<0.05) and highly significant (p<0.01) differences between the viability of treated cells and the untreated controls for each cell line are marked with * and **, respectively (paired t-test). For better visualisation of the cytotoxic effect of each drug, values are given as relative cytotoxicity (control cells = 0%, i.e. 100% viability).
Time-dependent cytotoxicity
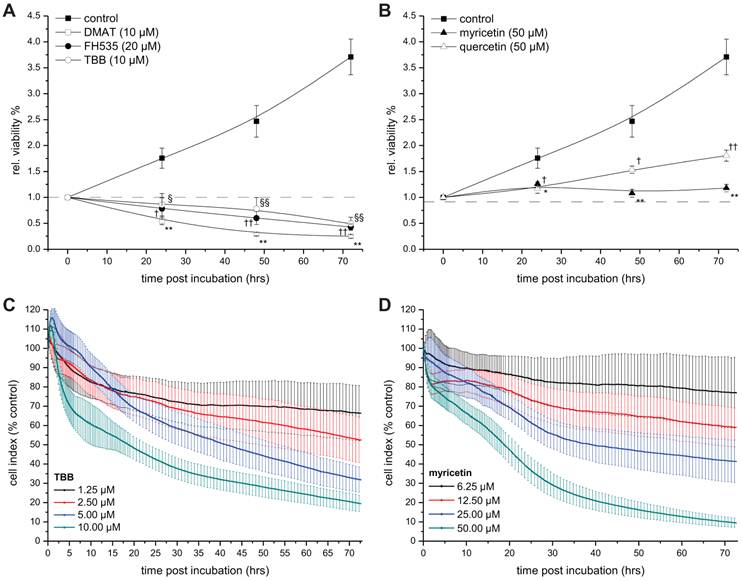
To investigate the temporal dynamics of the viability signal following incubation with the drugs, the resazurin assay was performed on CCLP-1 cells at 0, 24, 48, and 72 hrs post incubation (Fig. 3). For all inhibitors the viability signal is significantly lower than that of untreated control cells at all time points after incubation. Of note, the signal drops below the starting point (0 hrs, set to 1) after 24 hrs of incubation with DMAT, FH535 and TBB (Fig. 3A), whereas the viability signals after incubation with quercetin or myricetin show a continuous increase (yet slower than controls) or remain at the initial level ('1'), respectively.
As a second independent approach, the xCELLigence system was employed to obtain real-time data on the cellular growth / cytotoxicity kinetics up to 72 hrs after incubation with different concentrations of TBB and myricetin as representatives of drugs either inhibiting CK2 or showing other yet unspecified effects on Wnt / TCF signalling. As shown in Fig. 3 C, D, the four different concentrations of each drug result in a clear dose-dependent response: the two higher concentrations of both drugs (5 / 10 µM for TBB and 25 / 50 µM for myricetin) cause a continuous drop in the cell index (i.e. the well impedance as a measure of cell attachment) down to 10-20% indicating pronounced morphological changes most probable attributable to apoptotic cell death (see below, Fig. 4), i.e. rounding of cells accompanied by partial detachment from the substrate. In contrast, the cell index curves for the two lower concentrations (1.25 / 2.5 µM for TBB and 6.25 / 12.5 µM for myricetin) end up at approximately 70% and 60% of the control values, respectively. Subsequent analysis for IC50 values (see Table 2) provided values in the same order of magnitude than those calculated from Fig. 1 A, B.
Time-dependent viability. A, B. CCLP-1 cells were incubated with a single concentration of 10 µM DMAT, 20 µM FH535, 10 µM TBB (A) or 50 µM myricetin, 50 µM quercetin (B) in serum-free DMEM. At 0, 24, 48 and 72 hrs post incubation, the resazurin assay was used to determine the changes in viability compared to untreated control cells (set to 0% toxicity). Significant (p<0.05) and highly significant (p<0.01) differences between signal of treated cells and the untreated controls for each cell line are marked with * and **, respectively (ANOVA, LDS post-hoc test). C, D. CCLP-1 cells were incubated with four different concentrations of TBB or myricetin in serum-free DMEM. The well impedance expressed by the cell index as a measure of viability was analysed using the xCELLigence system as described in the Material and Methods section. Data points are related to the untreated control sample for each time point (set to 100%).
Correlation between drug cytotoxicity and the cellular phenotype of the nine BTC cell lines.
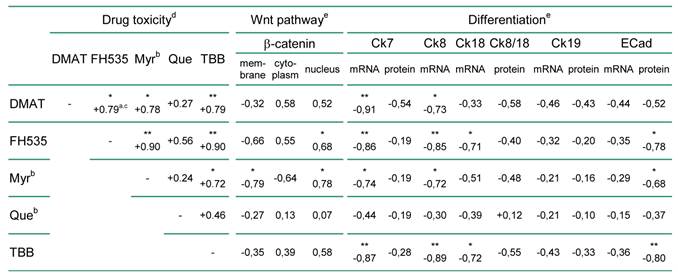
a positive or negative correlation coefficients indicate a direct or indirect relationship between drug efficiency and the correlated parameter (e.g. marker expression), respectively
b abbreviations: βCat, β-catenin; Ck, cytokeratin; ECad, E-Cadherin; Myr, myricetin; Que, quercetin
c correlation coefficient; * and ** indicate significant (p<0.05) and highly significant (p<0.01) correlations, respectively
d according to Fig. 2 A, B.
e see Supplementary Material: Table S3 for raw data
IC50 values of the compounds for CCLP-1 cells.
a clinical trials on chemoprevention and dietary intervention for different tumours (www.clinicaltrials.gov)
b estimated by linear interpolation between the data points around 50% cytotoxicity from Fig. 1 A, B
c calculated from the data obtained at 72 hrs after incubation with different concentrations using the RTCA software 1.2.1 (Roche Applied Science)
d n.c., not calculable, n.d., not determined
Apoptosis induction and cell cycle analysis
To further study the mode of cytotoxicity, two independent assays for apoptosis were performed (Fig. 4). The temporal dynamics of effector caspase-3/7 activation was measured at different time points after incubation as shown in Fig. 4 A, B (relative to total protein content). DMAT, FH535 and TBB show a clear time-dependent increase of the caspase signal which is highest for DMAT and significantly different than that of the control samples for all time points after incubation.
Apoptosis induction. CCLP-1 cells were incubated with 10 µM DMAT, 20 µM FH535, 10 µM TBB (A, C) or 50 µM myricetin, 50 µM quercetin (B, D) in serum-free DMEM and incubated for different periods. Caspase activity (A, B) was measured using a luminometric Caspase 3/7 assay as an indicator of apoptosis execution and related to the total protein content (a.u., arbitrary units). Nuclear fragmentation indicative of the late steps in the apoptotic process (C, D) was measured via fluorescence microscopy by Hoechst 33342 nuclear staining. Condensed and fragmented nuclei were counted as apoptotic cells. Representative phase contrast and Hoechst fluorescence microscopy images taken at 24 hrs after incubation are shown in E and F, respectively (scale bars indicate 50 µm). Significant (p<0.05) and highly significant (p<0.01) differences between signals (caspase signal or fractions of apoptotic nuclei) of treated cells and the untreated controls for each time point are marked with *, †, § and **, ††, §§ respectively (univariate ANOVA, LSD post-hoc test).
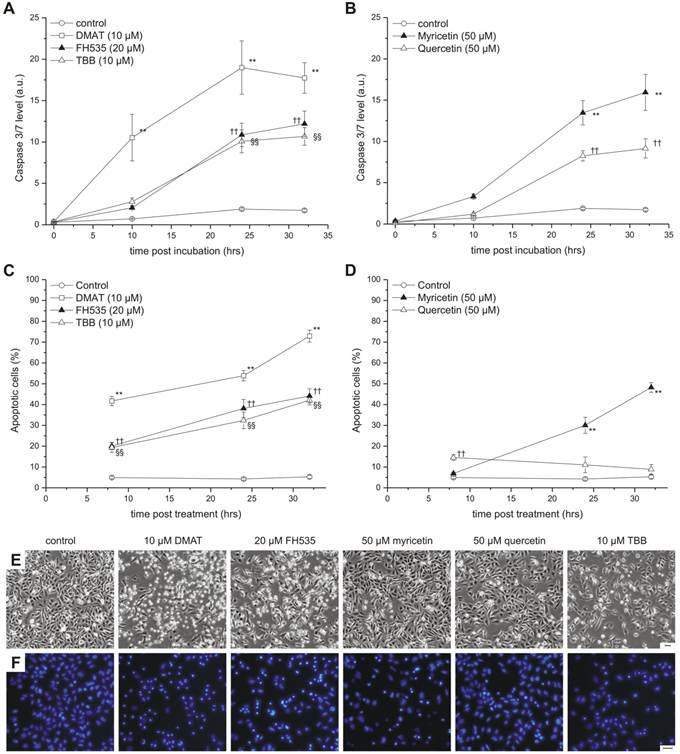
The temporal dynamic of caspase activation is similar for myricetin and quercetin but the signal significantly increases only after 24 or 32 hrs post incubation. As an indicator of the late steps in the apoptotic cascade, nuclear fragmentation was assessed at 6, 24 and 32 hrs post incubation (see Fig. 4 E for sample images): Figure 4C indicates a continuous increase in the percentage of cells with condensed or fragmented nuclei for DMAT, FH535 and TBB with 20 and 40% (6 hrs) and about 35 and 70% (32 hrs) for FH535, TBB or DMAT, respectively. Similar values but with a delayed temporal course are found for myricetin, which is in contrast to cells incubated with quercetin where the extent of apoptotic nuclei is in the range of only 10-15% (Fig. 4D).
In accordance with these data, cell cycle analysis (Fig. 5) performed after 48 hrs post incubation demonstrates for DMAT, myricetin and TBB a significant increase of cells in the subG1 population (i.e. decreased DNA content of apoptotic cells). A decrease of the cell fraction undergoing DNA replication (S phase) is observable for myricetin. A similar, yet not significant trend to an increased apoptotic subG1 population is also seen for FH535 and quercetin.
Cell cycle analysis. CCLP-1 cells were incubated with either 10 µM DMAT, 20 µM FH535, 50 µM myricetin, 50 µM quercetin or 10 µM TBB in serum-free DMEM and incubated for 48 hrs. Analysis of cell cycle distribution was performed using ethanol-fixed, RNase-treated and PI-stained cells by flow cytometry. The percentage of cells in G0G1, S/G2, or below G0G1 (subG1 fraction) cell cycle phases was analysed with the FlowMax software (Partec, Görlitz, Germany). The subG1 fraction is a measure of apoptotic cell death as these cells have undergone apoptotic DNA fragmentation. Significant (p<0.05) and highly significant (p<0.01) differences between population sizes of treated cells and the untreated controls for each cell cycle phase are marked with * and **, respectively (univariate ANOVA, LSD post-hoc test).
Effect on Wnt specific transcription
Based on the high cytotoxic efficiency of especially DMAT, FH535 and TBB, we further investigated whether these drugs have an influence on Wnt related transcriptional activity. To test this, we transfected CCLP-1 cells with a Wnt-specific reporter gene construct based on a luciferase luminescence readout and incubated the cells with constant concentrations of the inhibitors. The signals obtained after 6 hrs incubation (Fig. 6) indicate a highly significant reduction to 20% of control levels for DMAT, FH535 and TBB. In contrast, myricetin does not change TCF-dependent transcription and the values observed after quercetin treatment tend to be reduced, yet are not significantly different from that of control cells.
Wnt reporter gene assay. The Cignal Reporter gene assay was used to analyse the compound's effects on Wnt pathway specific transcriptional activity. In brief, CCLP-1 cells were transfected with the reporter construct for 24 hrs and afterwards treated with either 10 µM DMAT, 20 µM FH535, 50 µM myricetin, 50 µM quercetin or 10 µM TBB in serum-free DMEM for 6 hrs. Additionally, positive and negative controls were included and treated as controls (without inhibitors). The luminescence signal was read as a dual luciferase with 'FF' and 'RR' indicating the Wnt-specific (firefly luciferase) and the internal control signal (renilla luciferase), respectively. Significant (p<0.05) and highly significant (p<0.01) differences between the signals are marked with * and **, respectively (univariate ANOVA, LSD post-hoc test).
Changes in Wnt target gene expression
We finally tested the effect of the drugs on the expression of target genes and selected phenotypic markers on mRNA and protein level by qRT-PCR and semi-quantitative immunochemistry, respectively.
As shown in Fig. 8 A, a reduction of overall expression of the β-catenin protein is seen for DMAT, FH535 and TBB at both 5 and 24 hrs post treatment - a trend which is not observed for the mRNA levels (Fig. 7 A). At 24 hrs post incubation, FH535 and TBB rather increase the mRNA level of β-catenin. For quercetin, the protein levels of β-catenin generally are similar to that of untreated controls; myricetin reduces its expression after 24 hrs of treatment.
The anti-proliferative effects of the inhibitors are corroborated by reduced protein expression of cyclin D1 and the proliferation marker Ki67 (Fig. 8 B, C) showing significant changes for the majority of treatments except quercetin at 24 hrs. In accordance with these data, protein levels of the p27 cell cycle inhibitor (Fig. 8 D) as another negative target of Wnt signalling are increased especially at early time points after treatment. These changes are in part also observable in the data on mRNA expression (Fig. 7 B, C). Additionally, we measured overall expression of p53 protein as an indicator of active apoptosis signalling and vimentin as a mesenchymal marker. In line with data on apoptosis induction, the p53 protein shows increased expression especially after 24 hrs of treatment for all drugs except quercetin. Of note, the mesenchymal marker protein vimentin which is highly expressed in untreated control cells shows a reduction of up to 50% (FH535, TBB) - again, an effect which is more pronounced at later time points after incubation. Similar to the situation with β-catenin, this tendency cannot be seen in mRNA expression levels of vimentin (Fig. 7D). E-Cadherin as the corresponding epithelial marker shows an opposite behaviour: while barely or not detectable on mRNA or protein levels in control cells, drug treatment causes an up-regulation of its expression, especially on mRNA levels for DMAT, FH535 and TBB (Fig. 7H, 8G).
Effect on target mRNAs. Quantitative real-time reverse transcription PCR was used to investigate the compound's effect on expression of potential Wnt pathway target genes. CCLP-1 cells were treated with either 10 µM DMAT, 20 µM FH535, 50 µM myricetin, 50 µM quercetin or 10 µM TBB in serum-free DMEM for 5 or 24 hrs. Afterwards, total mRNA was isolated and quantified by qRT-PCR relative to β-actin as the housekeeping gene (see Material and Methods section for details). Values are given as 2-ΔCt, where ΔCt=Ct(x)-Ct(housekeeping gene) with β-actin as the housekeeping gene. Significant (p<0.05) and highly significant (p<0.01) differences between expression in treated versus control cells are marked with * and **, respectively (univariate ANOVA, LSD post-hoc test). Abbreviations: n.d., not determinable.
Effect on target proteins. Semi-quantitative immunochemistry was used to investigate the compound's effect on expression of potential Wnt pathway target genes. CCLP-1 cells were treated with either 10 µM DMAT, 20 µM FH535, 50 µM myricetin, 50 µM quercetin or 10 µM TBB in serum-free DMEM for 5 or 24 hrs. Afterwards, cell blocks were prepared, fixed in formalin and subjected to standard immunochemistry. Staining intensity was used for discrimination of positive versus negative cells. Significant (p<0.05) and highly significant (p<0.01) differences between percentages of positive cells within treated samples and the untreated control for each time point are marked with *, † and **, †† respectively (univariate ANOVA, LSD post-hoc test).
On mRNA level we additionally determined the expression of TCFL1 and -L2 (Fig. 7 E, F) as two major transcription factors responsible for regulation of target gene transcription following Wnt pathway activation. Interestingly, DMAT can significantly reduce their expression at 5h post incubation - however, at later time points (24 hrs) the levels of these mRNAs are either (in part significantly) increased or similar to the untreated control in case of myricetin. A similar trend is observable for axin2 which is another direct target of Wnt signalling: while DMAT can significantly reduce axin2 mRNA levels after 5 hrs, the expression level at 24 hrs post treatment is higher than in the untreated control sample (Fig. 7D).
Discussion
In the present study we tested a panel of small molecular weight compounds with previously reported inhibitory effects on Wnt signalling for their anti-cancer activity in BTC cells in an in vitro model. Of the substances used - DMAT, FH535, TBB, myricetin, and quercetin (see Table 2 for their chemical structures and characteristics) - the first three significantly cause efficient cytotoxicity, apoptosis induction and reduction of Wnt-specific reporter gene activity, whereas cytotoxicity is less pronounced for myricetin and quercetin which are, furthermore, characterised by a delayed time course of apoptosis induction. Effects on target gene expression include down-regulation of cell cycle-promoting factors such as cyclin D1 as well as up-regulation of the proliferation inhibitor p27 and are consistent with the known molecular targets of Wnt signalling [12, 31, 32]. The concentrations used in this study are similar to examples previously reported, i.e. 10 µM for DMAT [18, 33] and TBB (e.g. [18]), 20 µM for FH535 [19] and 50 µM for myricetin and quercetin [34].
In contrast to the single target specificity of (monoclonal) antibody-based therapies, small molecular weight inhibitors usually have several molecular targets implicating that overall cellular responses may be a result of the multiple actions of these drugs. For example, Boly et al. [35] reported on the effects of quercetin used at 10% of its IC50 growth-inhibitory concentration in eight different cell lines on multiple kinases and found that the activity was reduced by >80% for 16 kinases most of which are involved in control of mitotic processes [35]. This is also valid for casein kinase II inhibitors (DMAT, TBB) as this protein has several tumourigenic functions which may not exclusively rely on its involvement in Wnt signalling [36]. Similarly, myricetin has effects on several different signalling mechanisms including ERK1/2 [37], c-FLIP and Bcl-2 [38], Akt [39], DNA topoisomerases I and II [40], as well as JAK1 [41]. Although such off-target effects cannot be excluded for these compounds in the BTC cell lines, at least for DMAT, FH535 and TBB the Wnt transcription-specific reporter assay results suggests that some of their cytotoxic action is based on blocking of Wnt target gene transcription. These results are in line with Handeli et al. who reported that FH535 down-regulates β-catenin-TCF/LEF-dependent transcription and is effective only in cell lines that express the Wnt / β-catenin pathway [19]. Recently, a study by Vaid et al. could show reduced nuclear accumulation of β-catenin in melanoma cell lines after treatment with FH535 [42]. Furthermore, active CK2 is a prerequisite for Wnt signal transduction in the cytoplasm [20, 21] and causes increased expression of the anti-apoptotic protein survivin via a β-catenin-TCF/LEF-dependent transcription [43].
As expected from the dose-dependent viability analysis using one representative cell line (CCLP-1) the overall cytotoxicity of myricetin and quercetin is less pronounced in the panel of nine BTC cell lines. For DMAT, FH535 and TBB cytotoxicity is >60% in six of nine cell lines and at least 40% in three of the nine cell lines. This suggests that these compounds are highly effective in most BTC cellular phenotypes whereas myricetin and quercetin, at best, show moderate effects. Additionally, the cytotoxicities of the more effective drugs (DMAT, FH535 and TBB) are positively correlated indicating that cell lines responsive to either DMAT, FH535 or TBB also respond to treatment with one of the other two drugs. Although correlation analysis with the cellular phenotype as well as the intracellular protein localisation of β-catenin indicates that the cytotoxicity is more pronounced in cells with rather cytoplasmatic and nuclear β-catenin - i.e. active Wnt pathway - as well as in undifferentiated cells (low cytokeratin and E-Cadherin expression) the current results could not identify a molecular factor within the analysed parameters which can unequivocally predict the response towards these drugs. As this study uses overall viability and apoptosis induction as summative measures of the drug efficiencies, additional factors such as differential uptake into or export from the cells cannot be excluded to influence the cellular effects of these drugs. As reported in previous studies, BTC tissue may harbour specific mutations in genes involved in Wnt signal transduction [17]. Therefore, the impact of Wnt component mutations need to be investigated in subsequent studies in order to obtain a causative explanation for the differential drug sensitivity seen in the current panel of BTC cell lines.
Time course analysis of the viability indicates a significantly reduced amount of viable cells for all treatments beginning at 24 hrs post incubation. For DMAT, FH535 and TBB the viability signals drops below the initial value ('0 hrs', at incubation) indicating a direct cytotoxic response towards these agents. A complementary assay was performed for TBB and myricetin using the xCELLigence system allowing real-time analysis of the temporal cellular dynamics in a label-free manner. These data essentially confirm those obtained with the classical viability test by showing a continuous drop in the cell index for the higher concentrations of the drugs and furthermore, by providing similar values for the IC50 concentration. For myricetin the reduction of the cell index is more pronounced than expected from the resazurin assay which indeed shows a significantly reduced viability compared to control cells, but a rather constant signal up to 72 hrs post incubation. This discrepancy can be explained by the fact that apoptotic cells are characterised by active metabolic processes until late steps in the apoptotic programme [44], i.e. show a high activity in enzyme-based viability tests such as MTT and resazurin while morphological features such as rounding and blebbing are already in progress and cause reduction in the cell index in the xCELLigence system.
To further investigate whether the reduction in overall viability is attributable to induction of apoptosis, we analysed independent hallmarks of apoptotic cell death including activation of effector caspases (capase-3/7), changes in cellular and nuclear morphology, i.e. rounding and cell blebbing as well as nuclear fragmentation, and appearance of cells with reduced DNA content in flow cytometry analysis. All inhibitors cause an increase in caspase activity whereas morphological changes and nuclear fragmentation are most predominant in cells treated with DMAT, FH535 and TBB. For myricetin and quercetin, this may be due to the lower level (and slightly delayed course) of apoptosis induction which can be seen in the caspase-3/7 time course. Several previous publications reported apoptosis-inducing activities for these compounds: e.g. for myricetin / quercetin in oesophageal carcinoma cells [34], keratinocytes [35] and human leukaemia cells [45]; for DMAT / TBB in C6 glioma [46], adrenocortical carcinoma [47] leukaemia [18], and MCF-7 breast cancer cells [33]. For FH535 only data from the initial publication [19] are available where a larger panel of cell lines were tested for the drug's effects in a 3H uptake assay - yet no assay for apoptosis was performed. When used with hepatocellular carcinoma cell lines [48], DMAT effectively reduced proliferation whereas no induction of apoptosis was found - however, more importantly, this study provided preliminary data on the in vivo anti-tumour activity of this drug [48].
Analysis of the target gene expression on protein level indicates a uniform and significant down-regulation of cell cycle-promoting cyclin D1 and the proliferation marker Ki67, whereas the cell cycle inhibitor p27 shows enhanced expression. These effects are most clear for DMAT, FH535 and TBB, and less pronounced for myricetin and quercetin. Although all inhibitors induce apoptosis as determined by caspase activation and nuclear fragmentation, this additional growth-inhibitory effect is in agreement with the finding from time-dependent viability analysis where myricetin and quercetin tend to be rather growth-inhibitory during the early time points after incubation. The protein levels of β-catenin are reduced in a significant portion of cells, especially after treatment with DMAT, FH535 and TBB corresponding to the results of the reporter gene assay thus suggesting that some of their effects are based on inhibiting Wnt pathway activity. Analysis of the mRNA expression of the Wnt transcription factors TCF7L1, -L2 and axin2 indicates that DMAT reduced their abundance at early time points after incubation followed by, however, an increased expression compared to controls at 24 hrs. This dynamics seems similar to the situation for mRNA expression of β-catenin which could be interpreted as a compensatory mechanism, i.e. in cells still viable at 24 hrs post incubation, an attempt is made to overcome the Wnt-inhibitory effects of the compounds by over-expression of Wnt pathway components. This hypothesis yet needs confirmation by detailed time-resolved studies including quantitative protein determination in case of the transcription factors.
Taken together, the current report provides evidence, that especially DMAT, TBB and FH535 (as well as myricetin and quercetin, albeit to a lesser extent) show considerable cytotoxic effects in BTC cells and - in case of DMAT, FH535 and TBB - that these effects are associated with inhibition of Wnt-dependent transcription. As a limitation of this study, no data on the in vivo efficiency of these drugs are yet available which obviously are required before considering these compounds for clinical trials in BTC patients. Although DMAT, FH535 and TBB show substantial cytotoxicity in all BTC cell lines it, furthermore, remains to be investigated which phenotypic feature could be used as a marker indicating which actual BTC phenotype is particularly susceptible towards treatment with these drugs. Further investigation based on the current data seems of special interest for BTC as a specific CK2 inhibitor (CX-4945, [49]) is available and currently undergoes initial clinical investigation for other cancers.
Supplementary Material
Table S1: Sequences of oligonucleotides used for real-time reverse transcription PCR. Table S2: Primary antibodies (pre-treatment: water bath at pH 9). Table S3: Immunocytochemistry raw data.
List of Abbreviations
APC: adenomatous polyposis coli; BTC: biliary tract cancer; CK2: casein kinase-2; DMAT: 2-dimethylamino-4,5,6,7-tetrabromo-1H-benzimidazole; DMEM: Dulbecco's modified Eagle's medium; FBS: foetal bovine serum; GSK3β: glycogen synthase kinase 3β; LRP: low density lipoprotein receptor-related protein; LSD: least significant difference; qRT-PCR: real-time reverse transcriptase-PCR; sfDMEM: serum-free DMEM; TBB: 4,5,6,7-Tetrabromo-2-azabenzimidazole.
Acknowledgements
This study was supported by the Jubiläumsfonds der Österreichischen Nationalbank (OeNB, grant No. 12677) and the research fund of the Paracelsus Medical University Salzburg (grant No. 08/07/037).
Conflict of Interests
The authors have declared that no conflict of interest exists.
References
1. Cadigan KM, Nusse R. Wnt signaling: a common theme in animal development. Genes Dev. 1997;11:3286-3305
2. Kelleher FC, Fennelly D, Rafferty M. Common critical pathways in embryogenesis and cancer. Acta Oncol. 2006;45:375-388
3. Shtutman M, Zhurinsky J, Simcha I. et al. The cyclin D1 gene is a target of the beta-catenin/LEF-1 pathway. Proc Natl Acad Sci U S A. 1999;96:5522-5527
4. Kim PJ, Plescia J, Clevers H. et al. Survivin and molecular pathogenesis of colorectal cancer. Lancet. 2003;362:205-209
5. Schmalhofer O, Brabletz S, Brabletz T. E-cadherin, beta-catenin, and ZEB1 in malignant progression of cancer. Cancer Metastasis Rev. 2009;28:151-166
6. Fodde R, Brabletz T. Wnt/beta-catenin signaling in cancer stemness and malignant behavior. Curr Opin Cell Biol. 2007;19:150-158
7. Barker N, Clevers H. Mining the Wnt pathway for cancer therapeutics. Nat Rev Drug Discov. 2006;5:997-1014
8. Lazaridis KN, Gores GJ. Cholangiocarcinoma. Gastroenterology. 2005;128:1655-1667
9. Valle J, Wasan H, Palmer DH. et al. Cisplatin plus gemcitabine versus gemcitabine for biliary tract cancer. N Engl J Med. 2010;362:1273-1281
10. Kiesslich T, Neureiter D, Wolkersdorfer GW. et al. Advances in photodynamic therapy for the treatment of hilar biliary tract cancer. Future Oncol. 2010;6:1925-1936
11. Hopfner M, Schuppan D, Scherubl H. Targeted medical therapy of biliary tract cancer: recent advances and future perspectives. World J Gastroenterol. 2008;14:7021-7032
12. Lustig B, Behrens J. The Wnt signaling pathway and its role in tumor development. J Cancer Res Clin Oncol. 2003;129:199-221
13. Gordon MD, Nusse R. Wnt signaling: multiple pathways, multiple receptors, and multiple transcription factors. J Biol Chem. 2006;281:22429-22433
14. Kiesslich T, Alinger B, Wolkersdorfer GW. et al. Active Wnt signalling is associated with low differentiation and high proliferation in human biliary tract cancer in vitro and in vivo and is sensitive to pharmacological inhibition. Int J Oncol. 2010;36:49-58
15. Ashida K, Terada T, Kitamura Y. et al. Expression of E-cadherin, alpha-catenin, beta-catenin, and CD44 (standard and variant isoforms) in human cholangiocarcinoma: an immunohistochemical study. Hepatology. 1998;27:974-982
16. Sugimachi K, Taguchi K, Aishima S. et al. Altered expression of beta-catenin without genetic mutation in intrahepatic cholangiocarcinoma. Mod Pathol. 2001;14:900-905
17. Tokumoto N, Ikeda S, Ishizaki Y. et al. Immunohistochemical and mutational analyses of Wnt signaling components and target genes in intrahepatic cholangiocarcinomas. Int J Oncol. 2005;27:973-980
18. Pagano MA, Meggio F, Ruzzene M. et al. 2-Dimethylamino-4,5,6,7-tetrabromo-1H-benzimidazole: a novel powerful and selective inhibitor of protein kinase CK2. Biochem Biophys Res Commun. 2004;321:1040-1044
19. Handeli S, Simon JA. A small-molecule inhibitor of Tcf/beta-catenin signaling down-regulates PPARgamma and PPARdelta activities. Mol Cancer Ther. 2008;7:521-529
20. Gao Y, Wang HY. Casein kinase 2 Is activated and essential for Wnt/beta-catenin signaling. J Biol Chem. 2006;281:18394-18400
21. Seldin DC, Landesman-Bollag E, Farago M. et al. CK2 as a positive regulator of Wnt signalling and tumourigenesis. Mol Cell Biochem. 2005;274:63-67
22. Park CH, Chang JY, Hahm ER. et al. Quercetin, a potent inhibitor against beta-catenin/Tcf signaling in SW480 colon cancer cells. Biochem Biophys Res Commun. 2005;328:227-234
23. Gelebart P, Anand M, Armanious H. et al. Constitutive activation of the Wnt canonical pathway in mantle cell lymphoma. Blood. 2008;112:5171-5179
24. Shan BE, Wang MX, Li RQ. Quercetin inhibit human SW480 colon cancer growth in association with inhibition of cyclin D1 and survivin expression through Wnt/beta-catenin signaling pathway. Cancer Invest. 2009;27:604-612
25. Kiesslich T, Neureiter D, Alinger B. et al. Uptake and phototoxicity of meso-tetrahydroxyphenyl chlorine are highly variable in human biliary tract cancer cell lines and correlate with markers of differentiation and proliferation. Photochem Photobiol Sci. 2010;9:734-743
26. Czekanska EM. Assessment of cell proliferation with resazurin-based fluorescent dye. Methods Mol Biol. 2011;740:27-32
27. Cai C, Rodepeter FR, Rossmann A. et al. Nef from SIV(mac239) decreases proliferation and migration of adenoid-cystic carcinoma cells and inhibits angiogenesis. Oral Oncol. 2011;47:847-854
28. Berman DM, Karhadkar SS, Maitra A. et al. Widespread requirement for Hedgehog ligand stimulation in growth of digestive tract tumours. Nature. 2003;425:846-851
29. Huang H, He X. Wnt/beta-catenin signaling: new (and old) players and new insights. Curr Opin Cell Biol. 2008;20:119-125
30. Nusse R. The Wnt Homepage. http://www.stanford.edu/group/nusselab/cgi-bin/wnt/
31. Behrens J, Lustig B. The Wnt connection to tumorigenesis. Int J Dev Biol. 2004;48:477-487
32. Miranda-Carboni GA, Krum SA, Yee K. et al. A functional link between Wnt signaling and SKP2-independent p27 turnover in mammary tumors. Genes Dev. 2008;22:3121-3134
33. Yde CW, Frogne T, Lykkesfeldt AE. et al. Induction of cell death in antiestrogen resistant human breast cancer cells by the protein kinase CK2 inhibitor DMAT. Cancer Lett. 2007;256:229-237
34. Chiu WT, Shen SC, Chow JM. et al. Contribution of reactive oxygen species to migration/invasion of human glioblastoma cells U87 via ERK-dependent COX-2/PGE(2) activation. Neurobiol Dis. 2010;37:118-129
35. Boly R, Gras T, Lamkami T. et al. Quercetin inhibits a large panel of kinases implicated in cancer cell biology. Int J Oncol. 2011;38:833-842
36. Duncan JS, Litchfield DW. Too much of a good thing: the role of protein kinase CK2 in tumorigenesis and prospects for therapeutic inhibition of CK2. Biochim Biophys Acta. 2008;1784:33-47
37. Shih YW, Wu PF, Lee YC. et al. Myricetin suppresses invasion and migration of human lung adenocarcinoma A549 cells: possible mediation by blocking the ERK signaling pathway. J Agric Food Chem. 2009;57:3490-3499
38. Siegelin MD, Gaiser T, Habel A. et al. Myricetin sensitizes malignant glioma cells to TRAIL-mediated apoptosis by down-regulation of the short isoform of FLIP and bcl-2. Cancer Lett. 2009;283:230-238
39. Kumamoto T, Fujii M, Hou DX. Akt is a direct target for myricetin to inhibit cell transformation. Mol Cell Biochem. 2009;332:33-41
40. Lopez-Lazaro M, Willmore E, Austin CA. The dietary flavonoids myricetin and fisetin act as dual inhibitors of DNA topoisomerases I and II in cells. Mutat Res. 2010;696:41-47
41. Kumamoto T, Fujii M, Hou DX. Myricetin directly targets JAK1 to inhibit cell transformation. Cancer Lett. 2009;275:17-26
42. Vaid M, Prasad R, Sun Q. et al. Silymarin targets beta-catenin signaling in blocking migration/invasion of human melanoma cells. PLoS One. 2011;6:e23000
43. Tapia JC, Torres VA, Rodriguez DA. et al. Casein kinase 2 (CK2) increases survivin expression via enhanced beta-catenin-T cell factor/lymphoid enhancer binding factor-dependent transcription. Proc Natl Acad Sci U S A. 2006;103:15079-15084
44. Plaetzer K, Kiesslich T, Krammer B. et al. Characterization of the cell death modes and the associated changes in cellular energy supply in response to AlPcS4-PDT. Photochem Photobiol Sci. 2002;1:172-177
45. Lee KW, Kang NJ, Rogozin EA. et al. Myricetin is a novel natural inhibitor of neoplastic cell transformation and MEK1. Carcinogenesis. 2007;28:1918-1927
46. Kaminska B, Ellert-Miklaszewska A, Oberbek A. et al. Efficacy and mechanism of anti-tumor action of new potential CK2 inhibitors toward glioblastoma cells. Int J Oncol. 2009;35:1091-1100
47. Lawnicka H, Kowalewicz-Kulbat M, Sicinska P. et al. Anti-neoplastic effect of protein kinase CK2 inhibitor, 2-dimethylamino-4,5,6,7-tetrabromobenzimidazole (DMAT), on growth and hormonal activity of human adrenocortical carcinoma cell line (H295R) in vitro. Cell Tissue Res. 2010;340:371-379
48. Sass G, Klinger N, Sirma H. et al. Inhibition of experimental HCC growth in mice by use of the kinase inhibitor DMAT. Int J Oncol. 2011;39:433-442
49. Siddiqui-Jain A, Drygin D, Streiner N. et al. CX-4945, an orally bioavailable selective inhibitor of protein kinase CK2, inhibits prosurvival and angiogenic signaling and exhibits antitumor efficacy. Cancer Res. 2010;70:10288-10298
50. Kiesslich T, Berr F, Alinger B. et al. Current Status of Therapeutic Targeting of Developmental Signalling Pathways in Oncology. Curr Pharm Biotechnol. 2011 epub
Author contact
![]() Corresponding author: Tobias KIESSLICH, Department of Internal Medicine I, Paracelsus Medical University / SALK, Muellner Hauptstrasse 48, 5020 Salzburg, Austria. Tel: ++43 662 448258346, Fax: ++43 662 44824837, Email: t.kiesslichat
Corresponding author: Tobias KIESSLICH, Department of Internal Medicine I, Paracelsus Medical University / SALK, Muellner Hauptstrasse 48, 5020 Salzburg, Austria. Tel: ++43 662 448258346, Fax: ++43 662 44824837, Email: t.kiesslichat
Received 2011-6-21
Accepted 2011-10-21
Published 2011-11-7