ISSN: 1449-2288International Journal of Biological Sciences

Int J Biol Sci 2012; 8(7):979-991. doi:10.7150/ijbs.4557 This issue Cite
Research Paper
Structural and Functional Difference of Pheromone Binding Proteins in Discriminating Chemicals in the Gypsy Moth, Lymantria Dispar
Yanxue Yu1, Fei Ma1, Yixia Cao1, Junhua Zhang1, Yongan Zhang2, Shengnan Duan1, Yadong Wei3, Shuifang Zhu1, Naizhong Chen1 ![]()
1. Institute of Plant Quarantine, Chinese Academy of Inspection and Quarantine, Beijing, China 100029;
2. Institute of Forest Ecological Environment and Protection, Chinese Academy of Forestry, Beijing, China 100091;
3. Animal and Plant and Foodstuffs Inspection Center, Tianjin Entry-Exit Inspection and Quarantine Bureau, Tianjin China 300458
Abstract
Pheromone-binding proteins (PBPs) of the gypsy moth, Lymantria dispar L., play an important role in olfaction. Here structures of PBPs were first built by Homology Modeling, and each model of PBPs had seven α-helices and a large hydrophobic cavity including 25 residues for PBP1 and 30 residues for PBP2. Three potential semiochemicals were first screened by CDOCKER program based on the PBP models and chemical database. These chemicals were Palmitic acid n-butyl ester (Pal), Bis(3,4-epoxycyclohexylmethyl) adipate (Bis), L-trans-epoxysuccinyl-isoleucyl-proline methyl ester propylamide (CA-074). The analysis of chemicals docking the proteins showed one hydrogen bond was established between the residues Lys94 and (+)-Disparlure ((+)-D), and л-л interactions were present between Phe36 of PBP1 and (+)-D. The Lys94 of PBP1 formed two and three hydrogen bonds with Bis and CA-074, respectively. There was no residue of PBP2 interacting with these four chemicals except Bis forming one hydrogen bond with Lys121. After simulating the conformational changes of LdisPBPs at pH7.3 and 5.5 by constant pH molecular dynamics simulation in implicit solvent, the N-terminal sequences of PBPs was unfolded, only having five α-helices, and PBP2 had larger binding pocket at 7.3 than PBP1. To investigate the changes of α-helices at different pH, far-UV and near-UV circular dichroism showed PBPs consist of α-helices, and the tertiary structures of PBP1 and PBP2 were influenced at pH7.3 and 5.5. The fluorescence binding assay indicated that PBP1 and PBP2 have similarly binding affinity to (+)-D at pH 5.5 and 7.3, respectively. At pH 5.5, the dissociation constant of the complex between PBP1 and 2-decyl-1-oxaspiro [2.2] pentane (OXP1) was 0.68±0.01μM, for (+)-D was 5.32±0.11μM, while PBP2 with OXP1 and (+)-D were 1.88±0.02μM and 5.54±0.04μM, respectively. Three chemicals screened had higher affinity to PBP1 than (+)-D except Pal at pH5.5, and had lower affinity than (+)-D at pH7.3. To PBP2, these chemicals had lower affinity than the sex pheromone except Bis at pH 5.5 and pH 7.3. Only PBP1 had higher affinity with Sal than the sex pheromone at pH 5.5. Therefore, the structures of PBP1 and PBP2 had different changes at pH5.5 and 7.3, showing different affinity to chemicals. This study helps understanding the role of PBPs as well as in developing more efficient chemicals for pest control.
Keywords: Lymantria dispar, pheromone-binding protein, bioinformatics, discrimination, semiochemicals
Introduction
Insects have exquisitely sensitive olfaction, used to recognize the volatiles present in the air and find mate, food and oviposition sites. Usually such molecules are hydrophobic, and therefore are unable to cross the hydrophilic lymph of olfactory sensilla. Small proteins, called odorant-binding proteins (OBPs), have been suggested to be involved in the transport of the molecules from the environment to the dendrite membrane [1-3]. Recent experimental evidence, both from behaviour and molecular biology, may support a more specific role of OBPs in detecting and recognising semiochemicals [4-8].
OBPs are present in the sensillar lymph at very high concentration (up to 10mM) [3]. Lepidopteran OBPs can be divided into PBPs (pheromone-binding proteins) involved in the recognition of sex pheromones and GOBPs (general odorant-binding proteins) thought to participate in the recognition of general odorants [9]. Vogt and Riddiford [10] identified the first PBP in Antheraea polyphemus, then many proteins of the same family have been characterized in many species from several insect orders. Sequences of Lepidopteran PBPs show a conserved motif of six cysteine residues linked by three disulfide bonds [11].
The gypsy moth, Lymantria dispar L., is a widespread forest pest, which causes severe losses during outbreaks in Europe, Asia, and North America [12]. Its pheromone is (7R, 8S)-cis-2-methylepoxyoctadecane [13], also called (+)-disparlure ((+)-D). Two PBPs have been described in this species [14] that have been reported to selectively bind the two enantiomers of the pheromone [15]. Studies with a number of synthetic epoxides structurally similar to disparlure clearly demonstrate that a few key features of the molecule are critical for biological activity. The molecule of (+)-disparlure can be regarded as made of three different moieties: two aliphatic chains of different length linked to a central epoxide ring. A number of oxaspiropentane derivatives (OXPs) have been tested as potential (+)-disparlure analogues [16]. On the other hand, PBP1 and PBP2 have been reported to differently bind the various analogues [17], in a way also dependent on pH and ionic strength [18].
To date, the three-dimensional structures of several insect some OBPs have been solved by X-ray diffraction and/or NMR spectroscopy. These include a PBP from the giant silkworm moth Antheraea polyphemus (Apol PBP) [19, 20], the honeybee Apis mellifera L. ASP1 [21, 22], the Bombyx mori PBP1 [23, 24], the cockroach Leucophaea maderae PBP [25]. The three-dimensional structures of LdisPBPs so far have not been solved, and details of their mode of action are still not fully understood.
In this paper we built models of the two PBPs of L.dispar and simulated the binding of several potential ligands using molecular docking experiments. The affinity of PBP1 and PBP2 to (+)-disparlure and pheromone analogs was also measured in fluorescence binding assays, and the experimental results were compared with the bioinformatic predictions.
Materials and Methods
Three-dimensional structure modeling
A blast search of the amino acid sequence of LdisPBP1 and LdisPBP2 was conducted against the current Protein Data Bank (PDB; http://www.rcsb.org) to find structural templates. The sequences of Antheraea polyphemus pheromone-binding protein (ApolPBP) and Bombyx mori PBP are the most similar to LdisPBPs. Moreover, the structure of ApolPBP was also solved in complex with the specific pheromone 6E, 11Z-hexadeca-6, 11-dienyl-1-acetate (1QWV) [20]. Therefore ApolPBP was chosen as the template to build the 3D models of LdisPBP1 and LdisPBP2. Several initial models were constructed using Homology Modeling [26] in Discovery Studio3.0 (Accelrys Software Inc.), and the one with the highest score of Profiles-3D [27] was retained. To refine the initial homology model, the CHARMm [28] force field was employed and the following three energy minimization procedures were processed. First, minimization was carried out while all the hydrogen atoms were relaxed and the other atoms were fixed. Then, the side-chains were energy-minimized while the backbone chain was restrained. Finally, minimization was performed while all the atoms were relaxed. In each minimization procedure, two methods were used: the steepest descent method for 1000 steps, followed by the conjugated gradient minimization for another 1000 steps. The distance cutoff value of 14Å was used for counting nonbonded interaction pairs, and the long-range electrostatic interaction was calculated using the spherical cutoff method. The SHAKE algorithm [29] was applied to constrain the covalent bonds to hydrogen atoms during the minimization. Finally, the Profiles-3D method was used to evaluate the fitness between the sequence and the current 3D model.
Molecular docking
To screen for chemicals that might bind PBPs of the gypsy moth, all entries named epoxy in ChemBlink (online database of chemicals) were used in docking simulations with the predicted LdisPBPs models, using the CDOCKER program. The 3D structures of all chemical molecules were drawn and further refined with a steepest descent minimization for 1000 steps, followed by a gradient minimization for 1000 more steps, using the CHARMm force field. The active site pocket of the receptor was found automatically by the D S 3.0, the location of the pheromone in 1QWV being referenced for additional information. A site sphere with radius of 5 Å was set to assign the entire binding pocket. Other parameters were set as default. The top 20 docking poses ranked by the corresponding values of CHARMm energy were preserved to find the most probable binding mode and screen the chemicals having high score.
Preparation of LdisPBPs structures
Before being submitted to the constant pH molecular dynamics simulation in implicit solvent, the structures were embedded explicitly with a 7 Å water layer and optimized using a standard dynamics cascade, which includes two steps of minimization (steepest 500 steps and conjugate 2000 steps), and 50 ps heating, 100 ps equilibration and 500 ps NVT production simulations. Then LdisPBP1 and LdisPBP2 were respectively prepared at pH 7.3 and 5.5 according to Prepare Protein program in Discovery Studio 3.0.
Constant pH molecular dynamics (MD) simulation in implicit solvent
To explore the intrinsic dynamics and the structural stability and research the conformational changes in different pH of the modeled structures, we performed the 1.0 ns MD simulation without any harmonic restraints on the prepared model of LdisPBP1 and LdisPBP2. CHARMm force field was employed and the generalized born with molecular volume (GBMV) was used for implicit salvation. The system was minimized with 1000 steps of steepest descent algorithm followed by 1000 steps of conjugate gradient algorithm. The system was gradually heated to 300K for 50 ps. The following equilibration stage was 800 ps and the production was 1 ns with saving the conformation in 1ps, and the long-range electrostatic interaction was calculated using the spherical cutoff method. The SHAKE algorithm was not applied during the heating, equilibration and production stages. The structure from the simulation with the lowest potential energy of LdisPBP1 and LdisPBP2 at pH7.3 and 5.5 were considered as the centroid structure of that simulation since the average structures are not actual structures from the simulation.
Expression and purification of PBPs
For a better characterization of PBPs, both at the structural and functional level, we expressed PBP1 and PBP2 in a bacterial system. Sequences were designed to include an EcoRI and NotI restriction sites in the forward primer and the reverse primer, respectively.
For PBP1, the forward primer 5'-GAATTCATGTCGGCGAAACTACTG-3' and the reverse primer 5'-AATTGCGGCCGCTGTATCAGCCAGGAG-3'.
For PBP2, the forward primer 5'-GAATTCATGATGTGGCTTAGATTA-3' and the reverse primer 5'-AATTGCGGCCGCCTGTGATTCAGCTAA-3'.
PCR amplification was performed in the following conditions: a denaturing step at 95°C for 5 min, followed by 35 cycles (95°C for 30s, 55°C for 30s, 72°C for 30s), and a final step of 7 min at 72°C. The 420bp PCR product was purified and ligated into a pGEM-T easy vector (Promega, USA.). After transformation of Escherichia coli DH5α competent cell, the cells were plated on LB/agar, containing ampicillin, isopropyl thio-β-D-galactoside (IPTG) and 5-bromd-4-chloro-3-indolyl-β-D-galactoside (X-Gal). White colonies were then grown in liquid LB/ampicillin and analyzed for the presence of the positive clone. More than 10 independent clones were sequenced. For protein expression, E. coli BL21 (DE3) cells were transformed with the pET28a-LdisPBP1 and pET28a-LdisPBP2 plasmid with His-tag at the N-terminal sequence. Single colonies were grown overnight in 10 ml Luria-Bertani/Miller broth containing 100 mg/L ampicillin. The culture was diluted 1:100 with fresh medium and grown at 37°C until the absorbance at 600 nm reached 0.6 AU. At this stage, 0.25 mM IPTG as final concentration was added to the culture to induce expression at 18°C overnight. The cells were harvested by centrifugation, resuspended in 20 mM Tris-HCl pH 7.3, 200 mM NaCl, and 1 mM PMSF, and lysed by sonication. The supernatant was purified by Ni-resin affinity chromatography and the eluate was further purified by gel-filtration. The purity of proteins was checked with SDS-PAGE, and to make sure if the purified proteins were the target proteins, the bands on the gel were cut to do the analysis of peptide mass fingerprinting (PMF) according to the published protocols using the instrument (Ultraflex TOF/TOF, Bruker). The peptides were screened in the database of NCBInr and SwissProt on the website (http://www.Matrixscience.com). The fractions were concentrated, and the concentration was measured by UV absorbtion at 280 nm.
Circular dichroism (CD) Spectroscopy
Circular Dichroism spectra (CD) were measured on a MOS 450 AF/CD (Biologic, France), using 1 mm quartz cuvette for the far-UV region (190 nm to 260 nm) and 10 mm quartz cuvette for the near-UV region (250 nm to 320 nm). Band width and scan speed were set as 0.5 nm and 100 nm/min. Protein samples were dissolved to a final concentration of 0.2 mg/ml (far-UV CD) and 1.6 mg/ml (near-UV CD), either in 20 mM ammonium acetate, pH 7.3, or in 20 mM sodium acetate, pH 5.5. The concentrations of the recombinant proteins were measured by UV absorbtion at 280 nm.
Fluorescence measurements
Emission fluorescence spectra were recorded on a Jasco FP-750 instrument at 25℃ in a right-angle configuration with a 1-cm light path quartz cuvette. The protein was dissolved in 50mM Tris-HCl, pH7.3 and 50mM Na2HPO4-Citric acid buffer, pH 5.5, respectively. 2μM of protein and the fluorescent probe N-phenyl-1-naphthylamine (1-NPN) were used. Fluorescence of 1-NPN was excited at 337 nm and emission was recorded between 370 and 470 nm. Spectra were recorded with a scan speed of 240 nm/min and three accumulations. The slit width used for excitation and emission was 10 nm.
To measure the affinity of the fluorescent ligands 1-NPN to LdisPBP1 and LdisPBP2, a 2μM solution of protein in 50mM Tris-HCl buffer, pH7.3 and 50mM Na2HPO4-Citric acid buffer, pH 5.5, respectively, was titrated with aliquots of 1mM ligand solution in methanol to a final concentration of 1-20μM. Binding of all chemicals to recombinant LdisPBPs was measured by competitive fluorescence assays, using 1-NPN as the fluorescent probe following the described protocol [30]. All ligands used in competition experiments were dissolved in HPLC purity grade methanol. Binding data were collected as three independent measurements.
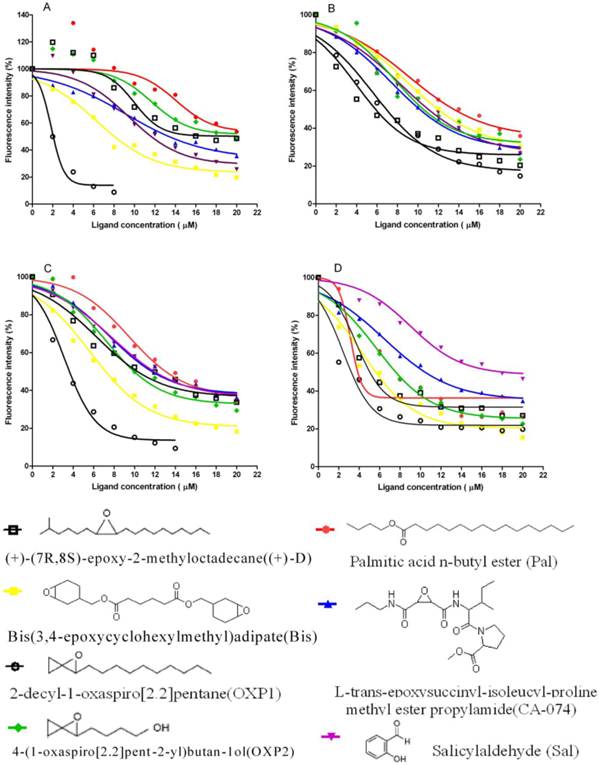
7 chemicals were used in competitive binding assays, the pheromone (+)-(7R, 8S)-epoxy-2-methyloctadecane ((+)-D), two analogues, 2-decyl-1-oxaspiro[2.2]pentane (OXP1), 4-(1-oxaspiro[2.2]pent-2-yl)butan-1-ol (OXP2) [16], three chemicals screened with CDOCKER, Palmitic acid n-butyl ester (Pal), Bis(3,4-epoxycyclohexylmethyl) adipate (Bis), L-trans-epoxysuccinyl-isoleucyl-proline methyl ester propylamide (CA-074), and salicylaldehyde (Sal) present in the host plant. These chemicals were tested at concentrations of 2, 4, 8, 10, 12, 14, 16, 18, 20 μM, and added as 1 mM stock solutions in methanol. Competitive binding experiments were performed in three replicates.
Concentrations of competitors that caused a reduction of fluorescence to half-maximal intensity (IC50 values) were taken as a measure of binding dissociation constants , and the dissociation constants (Ki) were calculated using the formula: Ki = [IC50]/(1 + [1-NPN]/K1-NPN), with [1-NPN] being the free concentration of 1-NPN and K1-NPN being the dissociation constant of the complex LdisPBPs/1-NPN, which was calculated from the binding curve using the computer program Prism 5.0 Trial (GraphPad Software Inc.). The competition curves were also analysed with Prism 5.0.
Results
Three-dimensional structure modeling
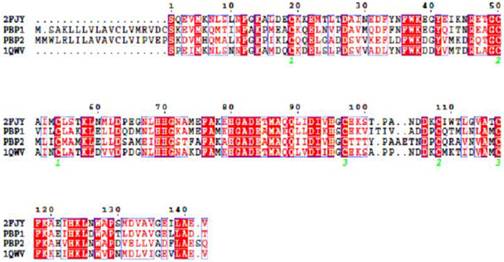
As templates for modeling the PBPs of L. dispar, we choosed the structures of A. polyphemus. With ApolPBP1 (1QWV), LdisPBP1 shares 55.2% sequence identity and 76.9% similarity, while LdisPBP2 shares 45.8% identity and 72.9% sequence similarity (Figure 1).
Sequence alignment of LdisPBP1, LdisPBP2, BmorPBP and ApolPBP. Identical residues were highlighted in white letters with a red background, residues with similar physico-chemical properties were shown in red letters. Aligned segments were framed in blue. The six conserved cysteines were marked with 1, 2 and 3, the same number indicating two cysteines connected by a disulfide bond.
Superimposed structures of ApolPBP(purple) and LdisPBP1 (A, green) and PBP2 (B, green). The NMR structure of the template ApolPBP was analyzed at pH 6.3. The models of LdisPBPs presented seven α-helices.
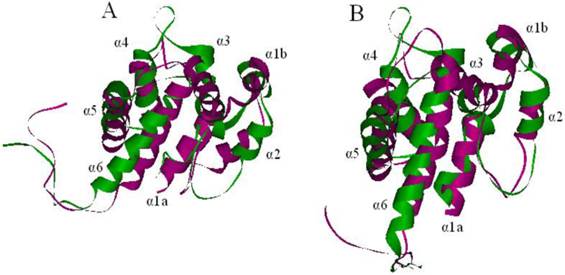
Using the template and the sequence alignment, the predicted 3D models of LdisPBP1 and LdisPBP2 were generated by Homology Modeling. After structural refinement, the Verify Score of the models by Profiles-3D was 62.11 (theoretical score 64.6862 and 29.1088) for LdisPBP1, and 54.66 (theoretical score 65.1422 and 29.314) for LdisPBP2, implying that the overall quality of the predicted LdisPBP1 and LdisPBP2 structures were reliable. In addition, the heavy atoms root mean square deviation (RMSD) between the models and the templates were 3.818 Å for PBP1 and 3.873 Å for PBP2, indicating that the differences between the models and the template in the overall structure were negligible (Figure 2A, 2B).
The predicted 3D structure of LdisPBP1 consisted of seven α-helices located between residues 1-14(α1a), 16-23 (α1b), 28-36(α2), 45-59(α3), 69-81(α4), 83-102(α5), and 107-126(α6), while in LdisPBP2 the six α-helices were located between residues 1-12(α1a), 16-24 ((α1b), 28-33(α2), 46-59(α3), 70-80(α4), 84-101(α5), and 109-126(α6). Three disulfide bridges connected Cys19 in α1b and Cys54 in α3, Cys50 in α3 and Cys109 in α6, Cys 97 in α5 and Cys118 in α6 for PBP1, and Cys19 in α1b and Cys54 in α3, Cys50 in α3 and Cys110 in α6, Cys 97 in α5 and Cys119 in α6 for PBP2 (Figure 1). In both models, most of the residues lining the binding pockets were hydrophobic (valine, leucine, isoleucine, methionine and phenylalanine). However, hydrophilic residues, such as threonine were also present in the binding sites and probably responsible for hydrogen bonding with the functional group of the ligand.
Molecular docking
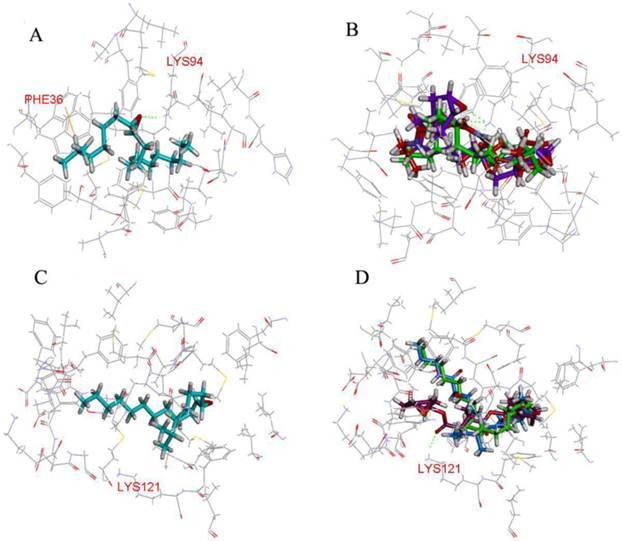
A first virtual screening, using the CDOCKER program, was performed with a database of 2410 compounds containing the epoxy group in order to find potential ligands for LdisPBP1 and LdisPBP2. Taking as a reference the position of (6E, 11Z)-hexadeca-6, 11-dienyl-1-acetate in the template 1QWV, all the top 20 ligands were placed in similar orientations. All the residues with distances from the ligand lower than 5Å were identified. In LdisPBP1 they were: Met5, Met8, Thr9, Phe12, Ala13, Phe33, Phe36, Trp37, Ile52, Leu55, Ala56, Leu61, Leu62, Leu68, His69, Ala73, Phe76, Ala77, Leu90, Leu91, Lys94, Met112, Leu115, Ala116, Phe119. For LdisPBP2 they were: Met5, His6, Met8, Ala9, Phe12, Ile16, Val29, Val30, Glu32, Phe33, Asp35, Phe36, Trp37, Lys38, Asp39, Gly40, Met43, Thr48, Met51, Leu52, Met55, Leu61, Phe76, Ile90, Val94, Val116, Ala117, Phe120, Lys121, and Val124. Three compounds were found to have high CDOCKER_ENERGY, recorded in the ChemBlink database as Palmitic acid n-butyl ester (Pal), Bis(3,4-epoxycyclohexylmethyl) adipate (Bis), L-trans-epoxysuccinyl-isoleucyl-proline methyl ester propylamide (CA-074). Pal is a linear compound, like (+)-D, and has two oxygen atoms. Bis has two epoxide rings and two oxygen atoms, and CA-074 has one epoxide ring and five oxygen atoms. The hydrophobic cavity of PBP1 was smaller than PBP2, including 25 residues. (+)-D formed one hydrogen bonds with Lys94 and л-л interactions with Phe36 (Figure 3A), while Bis and CA-074 formed two and three hydrogen bonds with Lys94, respectively (Figure 3B). PBP2 showed 30 residues in the binding pocket, and only Bis formed one hydrogen bonds with Lys121 (Figure 3D).
Molecular dynamics (MD) simulation in implicit solvent
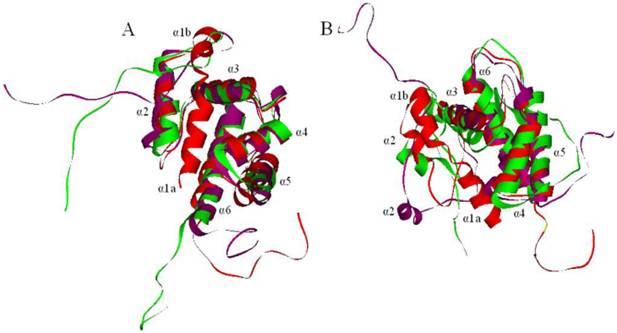
The models of PBPs at pH 7.3 and 5.5 were obtained after structural refinement. After about 500 ps, the potential energy of LdisPBPs models were stabilized, suggesting that a 1.0 ns unrestrained simulation was sufficient for stabilizing a fully relaxed model. The conformations with the lowest potential energy were screened with molecular dynamics. Compared with the model of LdisPBP1, the first α-helices of PBP1 unfolded at pH 7.3 and 5.5, and the distance between the second and the third α-helices did not change with pH (Figure 4A). So the binding pocket of PBP1 was also unchanged. In LdisPBP2 (Figure 4B), the first α-helix unfolded at pH 7.3 and 5.5, but the distance between the second and the third α-helices increased at pH 7.3 and the binding pocket became larger than that of PBP2 at pH 5.5.
Expression and purification of PBPs
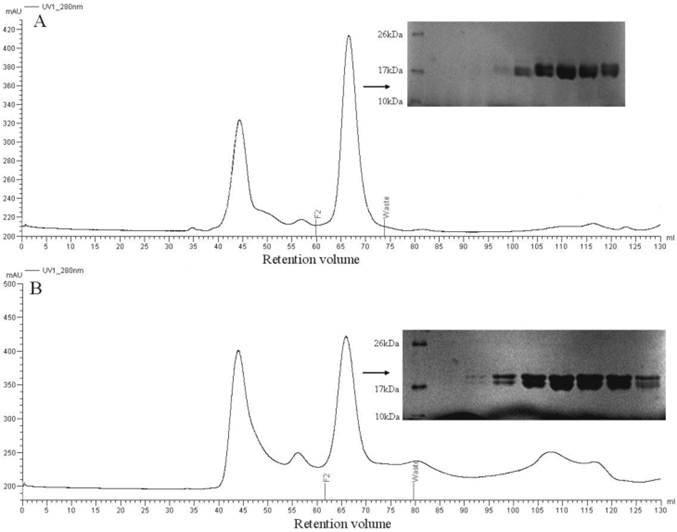
The mature proteins were expressed in E. coli BL-21 cells, and SDS-PAGE analysis of a sample of the bacterial pellet showed a major protein band being synthesized after induction with IPTG with yields of about 10 mg/L of culture and migrating with an apparent molecular mass of 17 kDa. After sonication, PBPs were present partly in the supernatants and were purified by two chromatographic steps on affinity resin Ni, followed by gel filtration on Superdex 75 (Figure 5A, 5B). After PMF analysis, the recombinant proteins were approved to be the target proteins. The purified recombinant proteins were used for circular dichroism analysis and ligand binding assays.
Molecular docking of LdisPBPs. The residues that were determined to be important for ligand binding were represented as stick models. Hydrogen bonds were shown as dashed lines in green. (A) (+)-D formed the hydrogen bond with residues Lys94 of LdisPBP1, and there was л-л interaction with residues Phe36. (B) Bis (purple) and CA-074 (blue) respectively formed two and three hydrogen bonds with residues Lys94 of LdisPBP1, and Pal (green) without forming any interaction. (C) (+)-D bound the binding pocket of LdisPBP2, without the hydrogen bonds forming. (D) Only Bis (purple) formed one hydrogen bond with residues Lys121 of LdisPBP2.
Molecular dynamics of PBPs. The models were shown in red, and the conformational changes were shown at pH 7.3 (purple) and 5.5 (green), seven α-helices were labeled. (A) The first α-helix of PBP1 unfolded at pH 7.3 and 5.5. (B) The first α-helix of PBP2 also unfolded completely, and the second α-helix of PBP2 extended from the third, increasing the binding cavity.
Purification of PBP1 (A) and PBP2 (B) by gel filtration chromatography after eluting from Ni resin. Proteins from indicated fractions (F2 to Waste) were separated by 14% SDS-PAGE gel and stained with Coomassie blue.
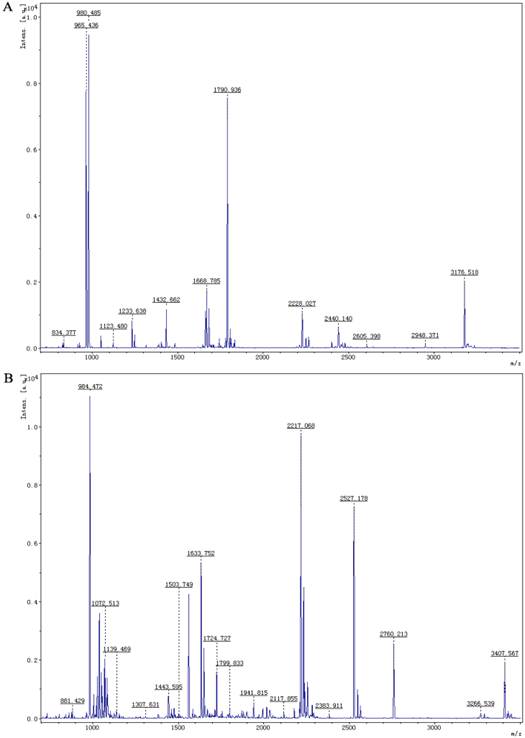
MALDI-TOF analysis of PBP1 (A) and PBP2 (B) following digestion with trypsin. The ratios of m/z were shown on the top of peaks.
Circular dichroism (CD) Spectroscopy
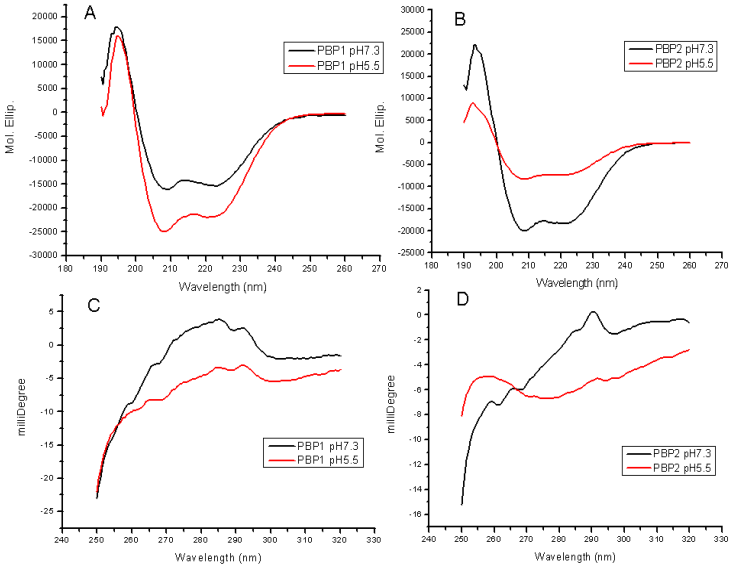
Changes in the far-UV CD and near-UV CD indicated a great conformational transition between pH 7.3 and 5.5. The secondary structures (far-UV CD) were obviously affected at different pH values (Figure 7A, 7B). The decrease in the spectrum intensity at 222 nm and 208 nm, corresponding to a decrease in helicity, indicated that some unwinding of helices occured, in agreement with the results of molecular dynamics. The content of α-helices in PBP1 at pH 5.5 was higher than that at pH 7.3, and PBP1 was more stable at pH 5.5. Conversely, the content of α-helices in PBP2 at pH5.5 was lower than that at pH7.3, and PBP2 was more stable at pH 7.3.
Near-UV CD revealed the changes of aromatic residues in microenvironment, without reference to changes of tertiary structures. LdisPBP1 contained nine aromatic residues, and LdisPBP2 eleven. The decrease in the intrinsic fluorescence at low pH also indicated that the aromatic residues become more exposed to solvent (Figure 7C, 7D).
Fluorescence measurements
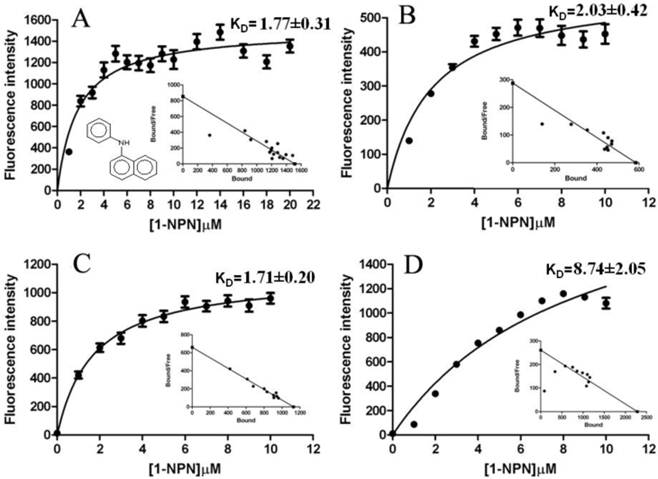
The fluorescence binding assays were performed at pH 7.3 and 5.5. When excited at 337 nm, 1-NPN displayed an emission peak at 460 nm, which shifted to about 395 nm in the presence of LdisPBP1, with a 50-fold increase in intensity, and to 420 nm in the presence of LdisPBP2, with a 20-fold increase in intensity. Under these conditions, we measured a dissociation constant of the LdisPBP1/1-NPN complex of 1.77±0.31 μM, and for LdisPBP2/1-NPN complex of 2.03±0.42 μM at pH 7.3. At pH 5.5 values are 1.71±0.20μM and 8.74 ±2.05μM, respectively (Figure 8). Table 1 lists the compounds tested in competitive binding assays and their dissociation constants.
Far-UV CD spectra (A, B) of LdisPBP1 and LdisPBP2 were measured at pH 7.3 (black trace) and pH 5.5 (red trace). The behaviours of PBP1 and PBP2 at pH 7.3 and 5.5 were opposite. Near-UV CD spectra (C, D) of LdisPBP1 and LdisPBP2 were measured at pH 7.3 (black trace) and pH 5.5 (red trace). Disruption of hydrogen bonds that keep the C-terminus covering the binding pocket may account for the changes in the environment of aromatic residues (Phe, Tyr and Trp) at low pH and consequently the decrease in amplitude.
Binding curves and relative Scatchard plots of the fluorescence probe (1-NPN) binding to recombinant PBP1 and PBP2 of gypsy moth. A and C report the curves relative to LdisPBP1 at pH 7.3 and 5.5, B and D those relative to LdisPBP2 at pH 7.3 and 5.5.
Dissociation constants of LdisPBPs to chemicals at pH 7.3 and 5.5, the statistical analysis showed the significantly difference between the six chemicals and (+)-D in longitudinal line after the Ki values (n=3), the horizontal lines did not analyze the difference because of different pH and proteins.
| Nomenclature | Abbreviation | PBP1[Ki(μM)] | PBP2[Ki(μM)] | ||
|---|---|---|---|---|---|
| pH5.5 | pH7.3 | pH5.5 | pH7.3 | ||
| (+)-(7R, 8S)-epoxy-2-methyloctadecane | (+)-D | 5.32±0.11a | 2.12±0.01a | 5.54±0.04a | 2.48±0.01a |
| 2-decyl-1-oxaspiro[2.2]pentane | OXP1 | 0.68±0.01b | 1.87±0.01b | 1.88±0.02b | 1.85±0.02b |
| 4-(1-oxaspiro[2.2]pent-2-yl)butan-1-ol | OXP2 | 6.33±0.18c | 2.99±0.08c | 5.14±0.06c | 2.46±0.02a |
| Palmitic acid n-butyl ester | Pal | 9.32±0.49d | 3.81±0.04d | 6.62±0.06d | 2.50±0.01a |
| Bis(3,4-epoxycyclohexylmethyl) adipate | Bis | 2.20±0.01e | 3.25±0.02e | 3.54±0.01e | 1.97±0.01c |
| L-trans-epoxysuccinyl-isoleucyl-proline methyl ester propylamide | CA-074 | 3.67±0.01f | 2.84±0.02f | 6.01±0.06f | 3.42±0.01d |
| Salicylaldehyde | Sal | 3.05±0.01f | 2.93±0.02cf | 6.06±0.06f | 5.32±0.07e |
PBP1 and PBP2 showed different affinities to chemicals, with significant differences between the two pH values. (Figure 9). At pH 5.5 some chemicals can not compete with the probe 1-NPN when proteins were at lower concentration, the fluorescence intensity becoming stronger than proteins complex with 1-NPN (Figure 9A).The binding affinity of the screened six chemicals to PBP1 and PBP2 had significantly different than (+)-D at pH 5.5 and 7.3, respectively. At pH 5.5, the dissociation constant of the complex between PBP1 and 2-decyl-1-oxaspiro[2.2]pentane (OXP1) was 0.68±0.01 μM, for (+)-D was 5.32±0.11μM, while those relative to the complexes between PBP2 and OXP1 or (+)-D were 1.88±0.02μM and 5.54±0.04μM, respectively. To OXP2, compared with (+)-D, PBP1 had lower affinity, PBP2 had higher affinity at pH 5.5, and similar affinity at pH 7.3. To OXP1, Pal, Bis, CA-074 and Sal, the affinity of PBP1 and PBP2 were significantly difference compared with (+)-D. The difference in the affinity of PBPs to OXP1 and OXP2 suggested that the epoxy group and the similarity of carbon chain were important factors for efficient binding to LdisPBPs. Three chemicals had higher affinity to PBP1 than (+)-D except Pal at pH 5.5, and had lower affinity than (+)-D at pH 7.3. To PBP2, these chemicals had lower affinity than the sex pheromone except Bis at pH 5.5 and pH 7.3. Only PBP1 had higher affinity with one of the volatiles of host plant, Sal, than the sex pheromone at pH 5.5. In principle, the affinities of PBP1 and PBP2 to all chemicals varied at different pH.
Competitive binding curves of some ligands to LdisPBPs. Solutions containing LdisPBP1or LdisPBP2 at pH 5.5 or 7.3 and 1-NPN, both at 2 μM concentration, were titrated with increasing amounts of competing ligands. The fluorescence intensity of LdisPBP1 (A) and PBP2 (C) binding chemicals at pH 5.5 were increased at their low concentration, the competitive effect occurred at high concentration. The competitive effect was obvious for LdisPBP1(B) and PBP2 (D) at pH 7.3. The structures of the compounds are shown, and the abbreviations of the compounds are reported after their names.
Discussion
In this study, we first built three dimensional models of LdisPBP1 and LdisPBP2, and identified the disulfide linkages, in agreement with the experiments of cyanylation reactions and cyanogens bromide chemical cleavage [31]. These are the first models of PBPs based on the 3D structure of template solved by NMR. PBP1 and PBP2 have 55.2% and 45.8% sequence identity with the template, respectively, the values of Profiles 3D and RMSD compared to the template, indicating that two good quality models have been created. And this method itself built the virtual structure within a short time, breaking the traditional idea to get the structures by NMR and/or crystallography for a long time. This research first use the structure modeling and molecular docking to screen potential chemicals that may influence the behavior of pest, furthermore, some active chemicals were surely screened by the chemical database.
The conformational changes of LdisPBPs depending on pH were first simulated by molecular dynamics. The C-terminal sequences of PBPs were unstructured, but this could be a result related to the template used in the homology modeling. The N-terminal sequences of PBPs were unfolded after simulating by molecular dynamics. Compared with the models having the lowest energy after optimizing, the second α-helix of PBP1 at pH 5.5 did not extend from the third α-helix, indicating that PBP1 at pH 5.5 was more stabilized than PBP2 at pH 5.5, in agreement with the data of far-UV CD. PBPs have some aromatic amino acids, the result of near-UV CD also indicated changes of location of such aromatic residues with pH. The conformational changes of PBP1 and PBP2 at pH 7.3 and 5.5 suggested that the function of PBP1 and PBP2 may be different from transporting chemicals. Unfolding of the PBP structure at different pH may be triggered by membranes of olfactory neurons [32]. The C-terminal dodecapeptide segment of BmorPBP formed a regular helix, α7, at pH 4.5, and at pH 6.5 did not present the additional α7 [23]. LmadPBP structure ended just after the sixth helix [25] and Culex quinquefasciatus OBP1 also lacked the C terminus required for the pH-dependent release model [33]. The pH-linked structural flexibility was also reported in other members of this class of proteins [34], with different characteristics. These differences also suggest that PBPs in different species present different binding and release mechanism.
Some potential semiochemicals have been screened based on the structures of PBPs, they differed from chemicals screened with electroantennogram [35], and they could elicit response by themselves, not require together with pheromone [36]. In initial field experiment (data not shown) CA-074 attracted more male L.dispar than did (+)-D alone, and the effects of Pal, Bis, and Sal were reverse. But these four chemicals had different binding affinity with PBPs, and PBP genes did not map to a quantitative trait locus for response to pheromone [37]. And therefore we can not classify them as agonists or antagonists of pheromone [38, 39], like (+)-D being a behavioral antagonists to pheromonal attraction of male L. mathura [40]. However, the different affinity of PBPs to chemicals showed that PBPs can recognize and decode the chemicals, and these chemicals did influence the behavior, but such result need to be confirmed in field experiments.
The structural and functional differences of LdisPBP1 and LdisPBP2 were explored for the first time. PBPs can discriminate the analogs of the pheromone, and the enhanced ligand binding was also seen at high ligand:PBP ratios [17]. But PBP2 preferentially bound (+)-disparlure, PBP1 preferentially bound (-)-disparlure [15], and this can not infer from the dissociation constants of PBP1 and PBP2 to (+)-D (Table 1). The (-)-enantiomer and (+)-enantiomer of the pheromone interacted with the ionizable residues on the protein in different way [18]. These subtly selective proteins appeared to be crucial to olfaction, but it is not yet clear what their role is [4]. OXP1 inhibited the effect of the pheromone, and OXP2 enhanced that of pheromone [16], PBP1 and PBP2 had higher affinity to OXP1 than to OXP2, which indicated that PBPs may have the function of discrimination. If PBP1 and PBP2 coexpress in one sensillum, according to the results of CD and the high concentration of PBPs in the lymph, PBP1 may distribute near to the pore of sensillum, and PBP2 near to the membrane of dendrite, they cooperate with each other to transmit the chemicals. If PBP1 and PBP2 express in different sensilla, different sensilla play different functions.
The difference in structure and function of LdisPBPs may be the reason having multiple divergent PBPs in one species. To the evolution of PBPs, the N-terminal amino acids of PBP1 and PBP2 in L.dispar share 50% identity, indicating that they were genetically distinct homologs [14], and they may be the result of relative recent independent, gene duplication events, rather than a single, ancient, duplication [41]. The distribution of PBPs will testify if these two PBPs are in one sensillum. The chemicals may be used in pest-control strategies by disrupting mate-searching behavior in gypsy moths, and the efficiency of trapping the gypsy moth will be further measured in the field.
Acknowledgements
We thank Dr. Paolo Pelosi for giving suggestions and proofreading.
Funding
This work was supported by a grant from the State Forestry Administration, P.R.China (grant number 200904029) to N. C and the National Natural Science Foundation (grant number 31000882) to Y. Y.
Competing Interests
The authors have declared that no competing interest exists.
References
1. Kaissling KE. Peripheral mechanism of pheromone reception in moths. Chem Senses. 1996;21:257-268
2. Pelosi P, Zhou JJ, Ban LP. et al. Soluble proteins in insect chemical communication. Cell Mol Life Sci. 2006;63:1658-1676
3. Vogt RG. The molecular basis of pheromone reception: its influence on behavior. In: (ed.) Prestwich GD, Blomquist GJ. Pheromone Biochemistry. New York: Academic Press. 1987:385-431
4. Xu P, Atkinson R, Jones DNM. et al. Drosophila OBP LUSH is required for activity of pheromone-sensitive nerurons. Neuron. 2005;45:193-200
5. Laughlin JD, Ha TS, Jones DNM. et al. Activation of pheromone-sensitive neurons is mediated by conformational activation of pheromone-binding protein. Cell. 2008;133:1255-1265
6. Matsuo T, Sugaya S, Yasukawa J. et al. Odorant-binding proteins OBP57d and OBP57e affect taste perception and host-plant preference in Drosophila sechellia. PLoS Biol. 2007;5:e118
7. Forstner M, Breer H, Krieger J. A receptor and binding protein interplay in the detection of a distinct pheromone component in the silkmoth Antheraea polyphemus. Int J Biol Sci. 2009;5:745-757
8. Swarup S, Williams TI, Anholt RR. Functional dissection of Odorant binding protein genes in Drosophila melanogaster. Genes Brain Behav. 2011; doi: 10.1111/j.1601-183X. 2011 00704.x
9. Vogt RG, Prestwich GD, Lerner MR. Odorant-Binding-Protein subfamilies associate with distinct classes of olfactory receptor neurons in insects. J Neurobiol. 1991;22:74-84
10. Vogt RG, Riddiford LM. Pheromone binding and inactivation by moth antennae. Nature. 1981;293:161-163
11. Breer H, Krieger J, Raming K. A novel class of binding proteins in the antennae of the silk moth Antheraea pernyi. Insect Biochem. 1990;20:735-740
12. Montgomery ME, Wallner WE. The gypsy moth - a westward migrant. In: (ed.) Berryman AA. Dynamics of Forest Insect Populations. Plenum Publishing Corporation. 1988:353-375
13. Miller JR, Mori K, Roelofs WL. Gypsy moth field trapping and electroantennogram studies with pheromone enantioners. J Insect Physiol. 1977;23:1447-1453
14. Vogt RG, Köhne AC, Dubnau JT. et al. Expression of pheromone binding proteins during antennal development in the gypsy moth, Lymantria dispar. J Neurosci. 1989;9(9):3332-3346
15. Plettner E, Lazar J, Prestwich EG. et al. Discrimination of pheromone enantiomers by two pheromone binding proteins from the gypsy moth Lymantria dispar. Biochem. 2000;39:8953-8962
16. Solari P, Crnjar R, Frongia A. et al. Oxaspiropentane derivatives as effective sex pheromone analogues in the gypsy moth: electrophysiological and behavioral evidence. Chem Senses. 2007;32:755-763
17. Honson N, Johnson MA, Oliver JE. et al. Structure-activity studies with pheromone-binding proteins of the gypsy moth, Lymantria dispar. Chem Senses. 2003;28:479-489
18. Kowcun A, Honson N, Plettner E. Olfaction in the gypsy moth, Lymantria dispar. J Biol Chem. 2001;276(48):44770-6
19. Mohanty S, Zubkov S, Campos-Olivas R. Letter to the editor: 1H, 13C and 15N backbone assignments of the pheromone binding protein from the silk moth Antheraea polyphemus (ApolPBP). J Biomol NMR. 2003;27:393-394
20. Mohanty S, Zubkov S, Gronenborn A. The solution NMR structure of Antheraea polyphemus PBP provides new insight into pheromone recognition by pheromone-binding proteins. J Mol Biol. 2004;337:443-451
21. Birlirakis N, Briand L, Pernollet J-C. et al. 1H, 13C, and 15N chemical shift assignment of the honey bee pheromone carrier protein ASP1. J Biomol NMR. 2001;20:183-184
22. Lartigue A, Gruez A, Briand L. et al. Sulfur single-wavelength anomalous diffraction crystal structure of a pheromone-binding protein from the honeybee Apis mellifera L. J Biol Chem. 2004;279:4459-4464
23. Horst R, Damberger F, Luginbuehl P. et al. NMR structure reveals intramolecular regulation mechanism for pheromone binding and release. Proc Natl Acad Sci USA. 2001;98:14374-9
24. Lee D, Damberger FF, Peng G. et al. NMR structure of the unliganded Bombyx mori pheromone-binding protein at physiological pH. FEBS Lett. 2002;531:314-318
25. Lartigue A, Gruez A, Spinelli S. et al. The crystal structure of a cockroach pheromone-binding protein suggests a new ligand binding and release mechanism. J Biol Chem. 2003;278(32):30213-8
26. Sali A, Blundell TL. Comparative protein modeling by satisfaction of spatial restraints. J Mol Biol. 1993;234:779-815
27. Luthy R, Bowie JU, Eisenberg D. Assessment of protein models with three-dimensional profiles. Nature. 1992;356:83-85
28. Brooks BR, Bruccoleri RE, Olafson BD. et al. CHARMM: A Program for Macromolecular Energy Minimization, and Dynamics Calculations. J Comp Chem. 1983;4:187
29. Rychaert JP, Ciccotti G, Berendsen HJC. Numerical integration of the Cartesian equations of motion of a system with constraints: Molecular dynamics of n-alkanes. J Comput Phys. 1977;23:327-341
30. Ban L, Scaloni A, D'Ambrosio C. et al. Biochemical characterization and bacterial expression of an odorant-binding protein from Locusta migratoria. Cell Mol Life Sci. 2003;60:390-400
31. Honson NS, Plettner E. Disulfide connectivity and reduction in pheromone-binding proteins of the gypsy moth, Lymantria dispar. Naturwissenschaften. 2006;93:267-277
32. Wojtasek H, Leal WS. Conformational change in the pheromone-binding protein from Bombyx mori induced by pH and by interaction with membranes. J Biol Chem. 1999;274(43):30950-6
33. Mao Y, Xu XZ, Xu W. et al. Crystal and solution structures of an odorant-binding protein from the southern house mosquito complexed with an oviposition pheromone. Proc Natl Acad Sci USA. 2010;107(44):19102-7
34. Leite NR, Krogh R, Xu W. et al. Structure of an odorant-binding protein from the mosquito Aedes aegypti suggests a binding pocket covered by a pH-sensitice “Lid”. Plos ONE. 2009;4(11):e80061-7
35. Plettner E, Gries R. Agonists and antagonists of antennal responses of gypsy moth (Lymantria dispar) to the pheromone (+)-disparlure and other odorants. J Agric Food Chem. 2010;58:3708-3719
36. Gong YM, Plettner E. Effects of aromatic compounds on antennal responses and on the pheromone-binding proteins of the gypsy moth (Lymantria dispar). Chem Senses. 2011;36:291-300
37. Gould F, Estock M, Hillier NK. et al. Sexual isolation of male moths explained by a single pheromone response QTL containing four receptor genes. Proc Natl Acad Sci USA. 2010;107:8660-5
38. Gries R, Khaskin G, Schaefer PW. et al. (7R, 8S)-cis7, 8-Epoxy-2-methyloctadec-17-ene: a novel trace component from the sex pheromone gland of gypsy moth, Lymantria dispar. J Chem Ecol. 2005;31:49-62
39. Gries R, Schaefer PW, Hahn R. et al. Sex pheromone components of Indian gypsy moth, Lymantria obfuscate. Chem Ecol. 2007;33:1774-1786
40. Gries R, Schaefer PW, Nakamura K. et al. Lymantria dispar sex pheromone is a behavioral antagonist to pheromonal attraction of male Lymantria mathura. Can Entomol. 2009;141:53-55
41. Merritt TJS, LaForest S, Prestwich GD. et al. Patterns of gene duplication in Lepidopteran pheromone binding proteins. J Mol Evol. 1998;46:272-276
Author contact
![]() Corresponding author: Naizhong Chen, Institute of plant quarantine, Chinese Academy of Inspection and Quarantine, No 241 Huixinxijie Road, Chaoyang District, Beijing, China 100029; Telephone: +86-010-64896658; Fax: +86-010-64896658; E-mail: chennznet.cn
Corresponding author: Naizhong Chen, Institute of plant quarantine, Chinese Academy of Inspection and Quarantine, No 241 Huixinxijie Road, Chaoyang District, Beijing, China 100029; Telephone: +86-010-64896658; Fax: +86-010-64896658; E-mail: chennznet.cn
Received 2012-5-4
Accepted 2012-7-20
Published 2012-7-30