ISSN: 1449-2288International Journal of Biological Sciences

Int J Biol Sci 2012; 8(10):1431-1446. doi:10.7150/ijbs.4664 This issue Cite
Research Paper
Influence of Carbon Monoxide on Growth and Apoptosis of Human Umbilical Artery Smooth Muscle Cells and Vein Endothelial Cells
Yajuan Li1,2*, Hai Wang1*, Bin Yang3*, Jichen Yang4, Xiuyan Ruan1, Yadong Yang1, Edward K. Wakeland1,2, Quanzhen Li2 ![]() , Xiangdong Fang1
, Xiangdong Fang1 ![]()
1. Laboratory of Disease Genomics and Individualized Medicine, Beijing Institute of Genomics, Chinese Academy of Sciences, Beijing, China.
2. Department of Immunology & Microarray Core Facility, The University of Texas Southwestern Medical Center at Dallas, Dallas, TX, USA.
3. Department of Cardiovascular Surgery, First Hospital of Tsinghua University, Beijing, China.
4. Division of Biostatistics, Department of Clinical Sciences, The University of Texas Southwestern Medical Center at Dallas, Dallas, TX, USA.
* These authors contributed equally to this work.
Abstract
Carbon monoxide (CO) is a vasoactive molecule that is generated by vascular cells as a byproduct of heme catabolism and it plays an important physiological role in circulation system. In order to investigate whether exogenous CO can mediate the growth and proliferation of vascular cells, in this study, we used 250 parts per million (ppm) of CO to treat human umbilical artery smooth muscle cell (hUASMC) and human umbilical vein endothelial cell (HuVEC) and further evaluated the growth and apoptosis status of SMC and HuVEC. After SMC and HuVEC were exposed to CO for 7-day, the growth of SMC and HuVEC was significantly inhibited by CO in vitro on day 5 of CO exposure. And CO blocked cell cycle progress of SMC and HuVEC, more SMC and HuVEC stagnated at G0/G1 phase by flow cytometric analysis. Moreover, CO treatment inhibited SMC and HuVEC apoptosis caused by hydrogen peroxide through decreasing caspase 3 and 9 activities. To confirm the molecular mechanism of CO effect on SMC and HuVEC growth, we compared the gene expression profile in SMC and CO-treated SMC, HuVEC and CO-treated HuVEC. By microarray analysis, we found the expression level of some genes which are related to cell cycle regulation, cell growth and proliferation, and apoptosis were changed during CO exposure. We further identified that the down-regulated CDK2 contributed to arresting cell growth and the down-regulated Caspase 3 (CASP3) and Caspase 9 (CASP9) were associated with the inhibition of cell apoptosis. Therefore, CO exerts a certain growth arrest on SMC and HuVEC by inhibiting cell cycle transition from G0/G1 phase to S phase and has regulatory effect on cell apoptosis by regulating the expression of apoptosis-associated genes.
Keywords: CO, smooth muscle cell, human umbilical vein endothelial cell, cell proliferation, apoptosis.
Introduction
Carbon monoxide (CO) is generated in most cells as one byproduct of heme degradation by heme oxygenase-1 (HO-1) [1]. In the previous decade, although the toxic effects of CO have been recorded, low concentration of CO has been reported to exhibit homeostatic effect [2]. More evidence suggests that endogenous CO as the byproduct of heme degradation can modulate inflammation, and inhibit lipopolysaccharide (LPS)-induced production of cytokines, and consequently show important cytoprotective function and anti-inflammatory property that are beneficial for the inflammation treatment [3, 4]. For example, inhaling 250 parts per million (ppm) concentrations of CO has been shown to be profitable in the repair of lung injury model, including hyperoxic injury allergen-induced inflammation [5]. CO derived from HO catalysis has been identified as one of endogenous biological messengers and vasoactive molecules which play an important physiological role in the cardiovascular circulation system.
CO has been reported to demonstrate an important role in the regulation of cell function. Especially in blood vessels, the release of CO generated by vascular cells exerts the potential anti-inflammatory, anti-apoptotic and anti-proliferative effects on endothelial cells, vascular smooth muscle cells (SMC) and other circulating blood cells by modulating intracellular paracrine and autocrine signaling pathways [6-9]. CO also regulates blood flow and blood fluidity by inhibiting vasomotor tone, SMC proliferation, and platelet aggregation which provide potential therapeutic effect for cardiovascular and lung diseases [9-12]. In addition, exogenous CO also has an important regulatory effect on blood vessel system, it can relax blood vessels [13]. Another study indicated that exogenous CO was capable of effectively inhibiting inflammatory response and oxidative stress in the activated HuVEC [14]. The exogenous administration of CO reduced the generation of reactive oxygen species (ROS) to prevent cell injury, this CO-dependent effect was shown to be independent of the activity of endogenous HO and the antioxidant potential of exogenous CO involved the activation of the p38 MAPK signal transduction pathway [15]. Similar to nitric oxide (NO), CO mediates platelet aggregation and relaxes blood vessels via activating soluble guanylyl cyclase (sGC) and consequently elevating intracellular levels of cyclic guanosine-3', 5'-monophosphate (cGMP) in target tissues [16]. CO is a powerful vasodilator and may serve as an important modulator of vascular cell function [17]. Thus, CO may be used to treat various cardiovascular disorders, including endotoxin shock, ischemia-reperfusion, hypertension, and subarachnoid hemorrhage.
Since CO either exogenously administered or endogenously derived from heme oxygenase-1 is a potential inhibitor of vascular SMC proliferation and apoptosis partly by activating the cGMP signaling pathway, the ability of CO to inhibit vascular cell growth and apoptosis may play an important role in attenuating lesion formation at sites of vascular damage [18, 19], which indicated CO has a novel therapeutic potential in treatment of some vascular diseases. Therefore, in this study, we investigated the effect of CO on cell growth and apoptosis in vascular SMC and HuVEC, we hope that the present results will contribute to understanding the regulatory role of CO on the growth and apoptosis of SMC and HuVEC in vitro and its regulatory molecules and probable signaling pathways.
Materials and methods
Human umbilical artery smooth muscle cell (SMC) and vein endothelial cell (HuVEC) isolation and culture
Neonate umbilical cord (UC) was collected from healthy donors with informed consent according to the guidelines of Institutional Review Board of Beijing Institute of Genomics, Chinese Academy of Sciences (BIG IRB:2012002). The umbilical artery and vein were isolated from the neonate UC. SMC and HuVEC were obtained after enzymatic treatment of the UC artery and vein followed by the procedure previously described [20]. Briefly, vascular SMC and HuVEC were isolated from the UC with elastase and collagenase digestion and characterized by morphological characteristics. SMC and HuVEC were seeded in culture flask respectively containing Smooth Muscle Cell medium and Endothelial Cell medium (ScienCell Research Laboratories, Carlsbad, CA) supplied with 10% fetal bovine serum (Invitrogen, Carlsbad, CA) and penicillin (100 U/ml)-streptomycin (0.1 mg/ml) (Invitrogen, Carlsbad, CA), and the cells were cultured in the incubator containing 5% CO2 for several passages. SMC can maintain their morphological and phenotypic characteristics within 10 passages, while HuVEC keeps their morphological and phenotypic characteristics within 15 passages. SMC and HuVEC used in the experiment are less than 10 passages.
Hematoxylin-eosin (HE) staining
Morphological characteristics of SMC and HuVEC were demonstrated by HE staining. Firstly, the cultured SMC and HuVEC were dispersed with 0.25% Trypsin-EDTA (Invitrogen, Carlsbad, CA), and then suspended in medium to generate the single suspension. Cell suspension was dropped to the carry sheet glass and cultured in incubators at 37°C until cell adhered to the glass. The carry sheet containing the cells was washed with PBS twice and 95% alcohol was added for 20 min, then washed briefly in distilled water and dried in the air. The cells were stained in hematoxylin solution for 20 min at room temperature, then the cells were washed in running tap water for 3 times and dried in the air. The cells were differentiated in 1% acid alcohol solution containing 1% hydrochloric acid and 70% alcohol for 20 sec, then washed in the running tap water for 3 times and dried in the air. Then the cells were returned blue in 1% ammonia water for 5 min and washed in the running tap water for 3 times and dried in the air. The cells were counterstained in eosin-phloxine solution for 10 min. Finally, cell morphology was observed under microscopy.
CO exposure
SMC and HuVEC were exposed to 250 ppm of CO via incubator. Gas from stock gas tanks containing CO and CO2, 0.025% volume ratio of CO and CO2 were mixed in a stainless steel cylinder prior to delivery into an exposure incubator. Air flows into the humidified incubator containing 250 ppm of CO and 5% CO2, and incubator temperature was maintained at 37°C. CO concentration in the incubator was constantly monitored with a CO electrochemical detection analyzer (Interscan, Chatsworth, CA).
Cell growth curve analysis
SMC and HuVEC were separately seeded in 60 mm culture dish at a density of 5.5X10⁴ and 4X10⁴. SMC and HuVEC in the culture dish were respectively cultured in different incubators at 37°C. The experimental cells were placed in incubator containing 250 ppm of CO and 5% CO2, while the control groups were placed in regular incubator with 5% CO2. Every 24 h for 7 days after the plating date, the cells were detached with 0.25% Trypsin-EDTA (Invitrogen, Carlsbad, CA) and the numbers of cells were counted. The cell counting was performed in triplicate, and data were presented as mean ± SEM.
Cell cycle analysis
SMC and HuVEC were plated in 60 mm culture dishes at the density of 2X10⁵ and cultured in the presence or absence of 250 ppm of CO at 37°C incubator for 6 h. Firstly, SMC and HuVEC were dispersed with 0.25% Trypsin-EDTA, then washed with phosphate-buffered saline (PBS) for twice, suspended in PBS to generate the single suspension, and fixed in 75% ethanol overnight at -20°C. The ethanol was removed by centrifuge, and SMC and HuVEC were suspended in PBS containing 10 µg/ml of RNase A for 30 min at 37°C, and then stained with 50 µg/ml of propidium iodide (PI). DNA fluorescence was measured on a Becton Dickinson FACScalibur flow cytometer (Bohemia, NY). The area versus the width of the fluorescent signal was analyzed to gate out cellular multiplets. Histograms of DNA content were analyzed using Modfit Lt V3.0 (Verity Software House, Topsham, ME) to determine fractions of the population in each phase of the cell cycle.
Heme oxygenase-1 (HO-1) enzyme-linked immunosorbent assay
In order to measure HO-1 protein level in SMC or HuVEC after CO exposure, SMC and HuVEC were lysated with lysis buffer at different CO exposure time point for 5 days. HO-1 protein in cell lysates was detected with an enzyme-linked immunosorbent assay (ELISA, Human Total HO-1/HMOX1, R&D, Minneapolis, MN) following the manufacture's instruction. Briefly, 100 μl of cell lysates and standard samples were respectively added into the wells of the 96-well plate already coated with capture antibody, incubated for 2 h at room temperature, and then the plate was washed for twice. 100 μl of the diluted detection antibody working solution was added into the wells and incubated for 2 h at room temperature, and then the plate was washed twice. 100 μl of the diluted streptavidin-HRP enzyme binding working solution was added and incubated for 20 min at room temperature, and then the plate was washed twice again. Then, 100 μl of substrate solution were added into the wells and incubated for 20 min at room temperature and protected from the light. Finally, 50 μl of stop solution were added to each well. Immediately determined the optical density (OD), using a microplate autoreader (Bio-Rad Model 680 Microplate Reader) at 450 nm. HO-1 protein concentration of the samples was determined based on a specific HO-1 standard curve.
Cell apoptosis analysis
Duplicate SMC and HuVEC were plated in 60 mm culture dishes at the density of 2X10⁵. When the cells obtained 70-80% confluence, SMC and HuVEC in one of dishes were treated with 0.4 mM hydrogen peroxide (H2O2). Then the cells were respectively cultured in the presence and absence of 250 ppm of CO at 37°C incubator for 16 h. Cells apoptosis were analyzed using Apoptosis and Necrosis Assay Kit with Hoechst 33342 and PI (Beyotime Institute of Biotechnology, Shanghai, China). Briefly, the cultured SMC and HuVEC were trypsinized, and then washed with PBS for twice, suspended in 100 µl cell staining buffer. Add 5 µl of Hoechst 33342 and 5 µl of the 10 µg/ml PI and incubate the cells at 4°C or keep the cells on ice for 20 min in the dark. After the incubation, the apoptotic cells were immediately analyzed using flow cytometry. In the meantime, apoptosis-associated molecules, caspase 3 and caspase 9 activities were detected. Activities of caspase 3 and 9 were determined using Caspase 3/9 Activity Assay Kit (Beyotime Institute of Biotechnology, Shanghai, China). Briefly, 20 μl of total protein in cell lysates were added to the reaction buffer, which contained 10 µl of the respective substrate, and incubated at 37°C for 2~3 h. Ac-DEVD-pNA (acetyl-Asp-Glu-Val-Asp p-nitroanilide) and Ac-LEHD-pNA (acetyl-Leu-Glu-His-Asp p-nitroanilide) were used as the corresponding fluorescent caspase-specific substrates of caspase 3 and 9, respectively. The enzyme-catalyzed release of pNA was quantified in a fluorimeter at 405 nm wavelengths. The concentration of total protein was detected with Quick Start™ Bradford Protein Assay (Bio-Rad, Hercules, CA).
Microarray analysis
Sample labeling and hybridization
Duplicate cultures of SMC and HuVEC were seeded in 100 mm dish at density 5X10⁵ cells and cultured in the presence or absence of 250 ppm of CO for 5 days. Total RNA was isolated from each of SMC and HuVEC samples and prepared for labeling and hybridization to Human-6-V3 Chip (Illumina, San Diego, CA). The quality of each RNA sample was assessed on Aglilent 2100 Bioanalyzer and NanoDrop-1000. 0.5 μg RNA was used as a template for cDNA and cRNA synthesis on PCR Thermo-cycler (Biometra, Horsham, PA). Sample labeling process was performed with the TotalPrep RNA Labeling Kit (Ambion, Austin, TX). About 1.5 μg cRNA samples were hybridized for 16 h at 58°C to a Human-6-V3 Expression Chip in hybridization oven (Illumina, San Diego, CA). After hybridization, the chip was washed and stained, finally scanned with iScan scanner to generate image data. Then the data were analyzed using BeadStudio software and genes differentially expressed between SMC and CO-treated SMC, HuVEC and CO-treated HuVEC were identified.
Generation of data and gene expression analysis
Firstly, BeadSudio software was used to extract data from iScan scanner, and hybridized arrays were expressed as fluorescence intensity. And then the intensity was converted into quantitative estimates of gene expression for each probe set. The probability statistic was generated for each probe set. Gene expression levels of SMC and CO-treated SMC, HuVEC and CO-treated HuVEC were analyzed based on 1.5 fold change logarithmic scale of the above the cells fluorescence intensity obtained from the iScan scanner.
Gene ontology (GO) analysis and network analysis
We did the GO analysis using Ingenuity Pathways Analysis (IPA, Ingenuity® Systems, www.ingenuity.com). The score of each GO category is the negative logarithm of p-value, which reflects the probability of finding the focus molecules in a given category by chance.
The network analyses were generated using IPA. The statistical scores were assigned automatically using the software while taking into account the user's set of significant genes, network size, and the total number of molecules in Ingenuity Knowledge Base. The network score is the negative logarithm of p-value, which reflects the probability of finding the focus molecules in a given network by chance. The identified network is then presented as a graph, indicating the molecular relationships between gene products.
Analysis on mRNA expression level of some genes associated with cell proliferation and apoptosis
Expression level of certain genes that are associated with cell proliferation and apoptosis was determined by quantitative real time PCR (QPCR) with ABI 7900HT Fast Realtime PCR System (Applied Biosystems). Total RNA was extracted from SMC and HuVEC with RNeasy kit (Qiagen, Valencia, CA). RNA was transcribed to generate cDNA with Superscript III using random primer (Invitrogen, Carlsbad, CA). QPCR reaction system was composed of 5 µl of 2 X TaqMan universal PCR master mix, 4.5 µl of cDNA and 0.5 µl 20 X TaqMan gene expression assay mix under the following thermal cycler conditions: 95°C for 10 min, followed by 40 cycles of 95°C for 15 sec and 60°C for 1 min. Each sample was run in triplicate. The assay IDs of the genes measured are as follow: MMP1 (Hs00899658_m1), MMP9 (Hs00957562_m1), MMP13 (Hs00942589_m1), TNFAIP6 (Hs00200180_m1), TNFSF13 (Hs00198106_m1) and VEGF (Hs01099206_m1). Relative quantity of these genes was calculated by using 18S rRNA (Hs03003631_g1) as internal control. Cell cycle associated gene, CDK2, apoptosis-associated genes, CASP3 and CASP9 were also detected. Primers for CDK2, CASP3, CASP9, and glyceraldehyde 3-phosphate dehydrogenase (GAPDH) were designed using PrimerBank (http://pga.mgh.harvard.edu/primerbank/index.html). Relative expression level of CDK2, CASP3 and CASP9 were calculated by using GAPDH as internal control. Primers were shown in Table S1.
Primers
| Sequence | |
|---|---|
| CDK2 Forward primer | 5'-GTACCTCCCCTGGATGAAGAT-3' |
| CDK2 Reverse primer | 5'-CGAAATCCGCTTGTTAGGGTC-3' |
| CASP3 Forward primer | 5'-CATGGAAGCGAATCAATGGACT-3' |
| CASP3 Reverse primer | 5'-CTGTACCAGACCGAGATGTCA-3' |
| CASP9 Forward primer | 5'-CTCAGACCAGAGATTCGCAAAC-3' |
| CASP9 Reverse primer | 5'-GCATTTCCCCTCAAACTCTCAA-3' |
| GAPDH Forward primer | 5'-TGTTGCCATCAATGACCCCTT-3' |
| GAPDH Reverse primer | 5'-CTCCACGACGTACTCAGCG-3' |
Statistical analysis
GraphPad Prism® version 5.0 was used for data analysis. Group data were expressed as mean ± SEM. Data were analyzed by standard statistical methods using two side unpaired Student's t-test and Fisher's exact test between two groups. p<0.05 was considered to be significant.
Results
Morphological characteristics of SMC and HuVEC
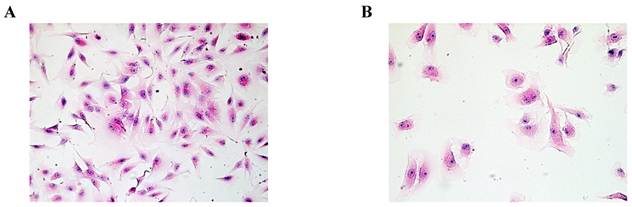
Based on HE staining, we observed SMC appeared fusiform or polygonal shape. The nucleus was big, and the nuclear chromatin was sparse, as shown in Fig.1A. HuVEC demonstrated flat and polygonal shape, its boundary was clear, cytoplasm was abundant. Nucleus was round or oval, nuclear chromatin was sparse and bright containing one or two nucleoli, as shown in Fig. 1B.
Effect of CO on SMC and HuVEC growth
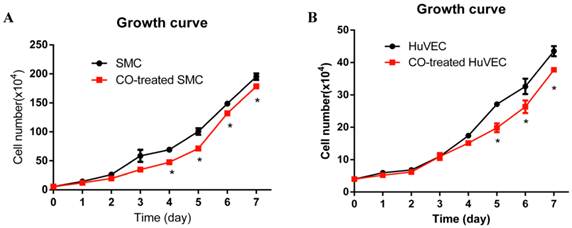
In order to observe SMC and HuVEC growth trend during CO exposure, the numbers of SMC and HuVEC in control group and CO-treated group were consecutively counted over 7-day period. Each time the cells in triplicate dishes were counted and data were presented as mean ± SEM. Compared with SMC in normal culture condition, the growth of SMC exposed to 250 ppm of CO was significantly arrested from day 4, as shown in Fig. 2A (*p<0.05). Whereas, the growth of HuVEC exposed to the same dose of CO was also arrested from day 5, as shown in Fig. 2B (*p<0.05).
Cell cycle analysis
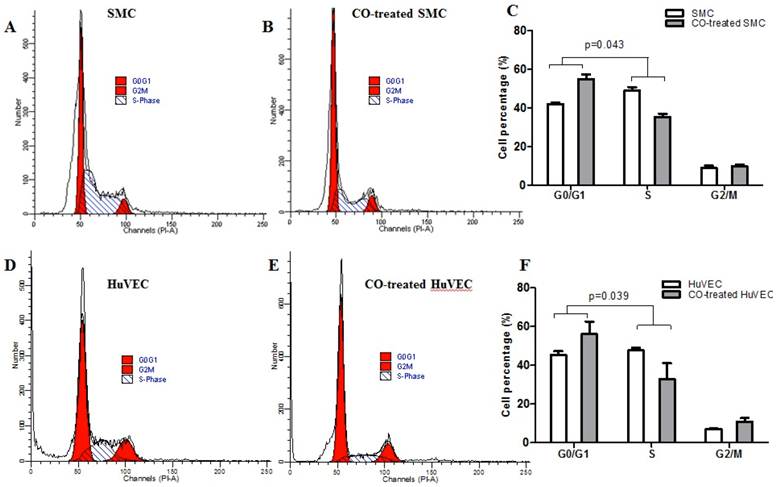
Flow cytometric data indicated that CO arrested SMC in the G1/S phase transition of the cell cycle compared with normal SMC. SMC in normal culture condition, the average percentage in G0/G1, S and G2/M phase was respectively 42.07%, 49.10% and 8.83%, while in CO-treated SMC, the average percentage in G0/G1, S and G2/M phase was respectively 54.95%, 35.46% and 9.79%. The representative flow cytometric image of SMC and CO-treated SMC were shown in Fig. 3A and 3B. There was a significant difference in cell percentage at G0/G1 and S phases between SMC and CO-treated SMC, shown in Fig. 3C (p<0.05). As for HuVEC, we observed the average percentage of HuVEC and CO-treated HuVEC in G0/G1, S and G2/M phase were 45.33%, 47.71%, and 6.96%, 56.10%, 32.98% and 10.92%. The representative cell cycle images of HuVEC and CO-treated HuVEC were shown in Fig. 3D and 3E. Also, there was a significant difference in percentage at G0/G1 and S phases between HuVEC and CO-treated HuVEC, more HuVEC was arrested in G0/G1 phase after CO treatment compared with control HuVEC, shown in Fig. 3F (p<0.05).
Morphological characteristics of SMC and HuVEC (HE staining, original magnification 200X). (A) The representative image of SMC HE staining. (B) The representative image of HuVEC HE staining.
Effect of CO exposure on SMC and HuVEC growth. SMC and HuVEC growth was observed over 7-day period treated and untreated with CO. The number of SMC and HuVEC was counted each day for 7-day (n=3 in each group at different time point). (A) SMC growth trend between normal condition and CO-exposed condition, on day 4 of CO exposure, SMC growth was significantly arrested (*p<0.05). (B) HuVEC growth trend between normal condition and CO-exposed condition, on day 5 of CO exposure, HuVEC growth was also obviously inhibited (*p<0.05).
SMC and HuVEC cell cycle detection during CO exposure by flow cytometry. After SMC and HuVEC were exposed to 250 ppm of CO for 6 h, cell percentage was analyzed in different cell cycle phase on SMC and HuVEC in the presence and absence of CO. (A) Representative flow cytometric analysis on SMC in G0/G1, S and G2/M phase in normal culture condition. (B) Representative flow cytometric analysis on SMC in G0/G1, S and G2/M phase in exposure to 250 ppm of CO condition for 6 h. (C) There was a significant difference in cell percentage in G0/G1 and S phase between SMC and CO-treated SMC (p=0.043). (D) Representative flow cytometric analysis on HuVEC in G0/G1, S and G2/M phase in normal culture condition. (E) Representative flow cytometric analysis on HuVEC in G0/G1, S and G2/M phase in exposure to 250 ppm of CO condition for 6 h. (F) There was also a significant difference in cell percentage in G0/G1 and S phase between HuVEC and CO-treated HuVEC (p=0.039).
HO-1 expression level in SMC and HuVEC with CO treatment
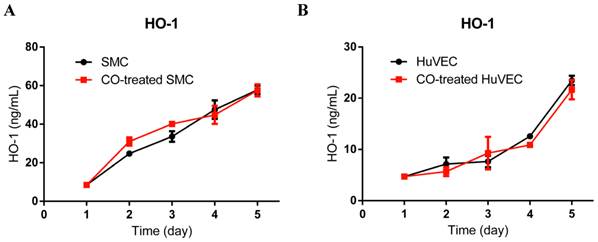
To investigate if exogenous CO may modulate the expression of HO-1, we used HO-1 ELISA kit to consecutively detect HO-1 expression in cell lysates after SMC or HuVEC exposed to 250 ppm of CO for 5 days. The results showed that HO-1 expression level between SMC and CO-treated SMC was no significant difference, as well as between HuVEC and CO-treated HuVEC, as shown in Fig. 4A and 4B.
Apoptosis of SMC and HuVEC with H2O2 treatment in the presence and absence of CO
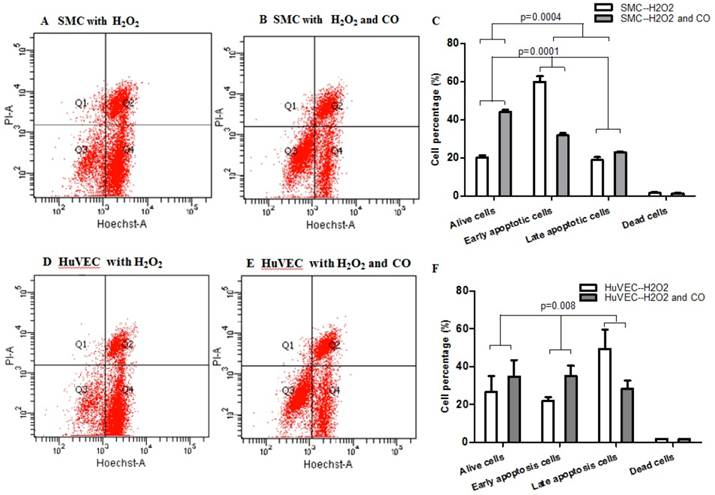
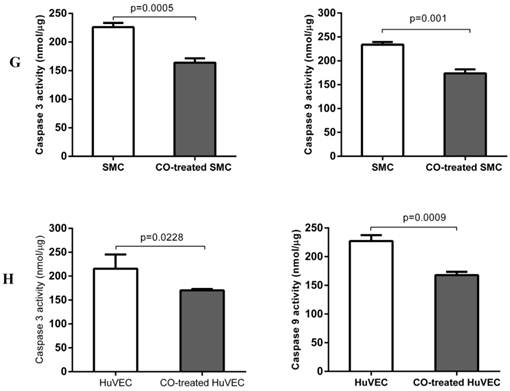
In order to prove whether exogenous CO can regulate cell apoptosis under oxidative stress, the number of SMC or HuVEC in live stage and apoptotic stage with 0.4 mM H2O2 treatment in the presence and absence of CO for 16 h was detected by apoptosis and necrosis assay kit. SMC treated with H2O2 and without CO exposure, the mean percentage of SMC in live stage, early and late apoptosis stage, dead stage was 19.94%, 59.82% and 18.74%, 1.52%, while SMC treated with H2O2 and exposed to CO, the mean percentage of SMC in live stage, early and late apoptosis stage, dead stage was 43.98%, 31.74% and 22.8%, 1.42%. As for HuVEC, we observed the similar results, and the mean percentage of HuVEC treated with H2O2 and without CO exposure in live stage, early and late apoptosis stage, dead stage was 26.76%, 49.42% and 22.0%, 1.84%, while HuVEC treated with H2O2 and CO, the mean percentage of HuVEC in live stage, early and late apoptosis stage, dead stage was 34.74%, 35.12% and 28.46%, 1.7%. The representative graphs of SMC and CO-treated SMC, as well as HuVEC and CO-treated HuVEC after H2O2 treatment were shown in Fig. 5A, B, D, and E. There was a significant difference in live and apoptotic cell percentage between SMC treated with H2O2 and SMC treated with H2O2 and CO, as well as between HuVEC treated with H2O2 and HuVEC treated with H2O2 and CO, shown in Fig. 5C and 5F. Furthermore, caspase 3 and caspase 9 activities were significantly reduced in SMC and HuVEC in presence of CO subjected to H2O2 treatment for 16 h (Fig. 5G and 5H, p<0.05). Thus after H2O2 treatment, the CO exposure can suppress SMC and HuVEC apoptosis.
CO regulates SMC growth and apoptosis by mediating the expression of cell cycle and apoptosis associated genes
About 1000 genes were changed in mRNA expression level between SMC and CO-treated SMC based on the fold change ≥1.5. Some differently expressed genes identified as more than 1.5-fold change between the SMC and CO-treated SMC were summarized in different functional groups, including cell growth, proliferation, apoptosis, cell cycle, and NF-κB signaling shown in Table 1. Some growth factors and receptors, NGF, NGFRAP1 and HBEGF were down-regulated after exposure to CO. These genes are related to the regulation of cell growth and proliferation. In addition, cell cycle progress related genes, such as, CDKN2A (p16) and CDK2 were also down-regulated after CO exposure. On one hand, the reduced ERK1/2 also affects the expression of downstream some genes in nucleus to limit cell growth and proliferation. Apoptosis-associated genes, CASP9 and BAK1 were down-regulated, which may cause cell apoptosis inhibition by NF-κB signaling pathway. Cell death associated gene, TRAF3IP1, was affected in CO-treated SMC compared with SMC.
HO-1 expression level in SMC and HuVEC after CO exposure. HO-1 expression level in SMC and HuVEC lysates was consecutively measured by ELISA for 5 days (n=3 in each group at different time point). (A) HO-1 expression level between SMC and CO-treated SMC. (B) HO-1 expression level between HuVEC and CO-treated HuVEC.
Effect of CO on the apoptosis of SMC and HuVEC caused by hydrogen peroxide (H2O2). Representative flow cytometric analysis on SMC and HuVEC stained with Hoechst staining and propidium iodide (PI) in the presence and absence of 250 ppm CO with 0.4 mM H2O2 treatment for 16 h. In each panel, “Q1” stands for “dead cells”. “Q2” stands for “late apoptotic cells”. “Q3” stands for “live cells”. “Q4” stands for “early apoptotic cells”. (A) Representative flow cytometric analysis on SMC in live stage, apoptotic stage and dead stage after SMC treated with 0.4 mM H2O2 for 16 h. (B) Representative flow cytometric analysis on SMC in live stage, apoptotic stage and dead stage after SMC treated with 0.4 mM H2O2 and 250 ppm of CO for 16 h. (C) There was a significant difference in cell percentage in live cells (Q3), early apoptotic (Q4) and late apoptotic cells (Q2) between SMC with H2O2 treatment and SMC with H2O2 and CO treatment (p=0.0001). And a significant difference in cell percentage in live cells (Q3) and apoptotic cells (Q2+Q4) between SMC with H2O2 treatment and SMC with H2O2 and CO treatment was also observed (p=0.0004). (D) Representative flow cytometric analysis on HuVEC in live stage, apoptotic stage and dead stage after HuVEC treated with 0.4 mM H2O2 for 16 h. (E) Representative flow cytometric analysis on HuVEC in live stage, apoptotic stage and dead stage after HuVEC treated with 0.4 mM H2O2 and 250 ppm of CO for 16 h. (F) There was a significant difference in cell percentage in live cells (Q3), early apoptotic cells (Q4) and late apoptotic cells (Q2) between HuVEC with H2O2 treatment and HuVEC with H2O2 and CO treatment (p=0.008). The live HuVEC in H2O2 and CO treatment group was higher than that HuVEC with H2O2 treatment. (G) Caspase 3 and 9 activities in cell lysates of SMC treated with H2O2 for 16 h. Caspase 3 and 9 activities were decreased in SMC exposed to CO with H2O2 treatment compared with SMC (n=3, p<0.05). (H) Caspase 3 and 9 activities in cell lysates of HuVEC treated with H2O2 for 16 h. Caspase 3 and 9 activities were decreased in HuVEC exposed to CO with H2O2 treatment compared with HuVEC (n=3, p<0.05). Values are expressed as mean±SEM.
Differentially expressed genes (fold change more than 1.5) between SMC and CO-treated SMC.
| Functional group Gene name | Gene symbol | Different expression CO treatment vs. control |
|---|---|---|
| Cell proliferation and cell cycle | ||
| Heparin-binding EGF-like growth factor | HBEGF | DOWN |
| Cyclin-dependent kinase inhibitor 2A | CDKN2A | DOWN |
| Cyclin-dependent kinase 2 | CDK2 | DOWN |
| Myocyte enhancer factor 2 | MEF2 | UP |
| SHC transforming protein 1 | SHC1 | DOWN |
| Growth arrest-specific 1 | GAS1 | UP |
| Cell death and apoptosis | ||
| BCL2-antagonist/killer 1 | BAK1 | DOWN |
| Caspase 9, apoptosis-related cysteine peptidase | CASP9 | DOWN |
| Phosphoinositide-3-kinase | PI3K | UP |
| TNF receptor-associated factor 3 interacting protein 1 | TRAF3IP1 | DOWN |
| NF-κB signaling | ||
| Nerve growth factor | NGF | DOWN |
| Nerve growth factor receptor (TNFRSF16) associated protein 1 | NGFRAP1 | DOWN |
| BMP2 inducible kinase | BMP2K | DOWN |
| TNF receptor-associated factor 3 interacting protein 1 | TRAF3IP1 | DOWN |
| Phosphoinositide-3-kinase | PI3K | UP |
| Mitogen-activated protein kinase kinase kinase 3 | MEKK3 | DOWN |
| Nuclear factor of kappa light polypeptide gene enhancer in B-cells 2 (p49/p100) | NFKB2 | DOWN |
CO mediates HuVEC growth by interrupting cell cycle progress and suppresses apoptosis by down-regulating expression of apoptosis genes
Around 600 genes were changed between HuVEC and CO-treated HuVEC based on the fold change ≥1.5. Some differently expressed genes identified as more than 1.5-fold were summarized in different functional groups and signaling pathways which are related to cell growth, proliferation, apoptosis, cell cycle regulation, shown in Table 2. Such as, CDKN2A (p16) was up-regulated after CO exposure. In addition, HDAC8, RFC3, and SHC1 were down-regulated. MEKK, MAPK and ERK1/2 in ERK/MAPK signaling were also regulated, and it may affect the expression of some genes in nucleus to modulate cell growth and proliferation. The expression of TNFRSF4 and TRAF3 was also affected by CO exposure, and these genes are related to cell death and apoptosis, so CO could regulate HuVEC death and apoptosis by corresponding pathways. In addition, CASP3 was down-regulated, which may inhibit HuVEC apoptosis. p38 MAPK and SMAD7 were down-regulated and may inhibit apoptosis by TGF-β signaling and ERK/MAPK signaling.
Distinct gene expression change between CO-treated and normal SMC and HuVEC
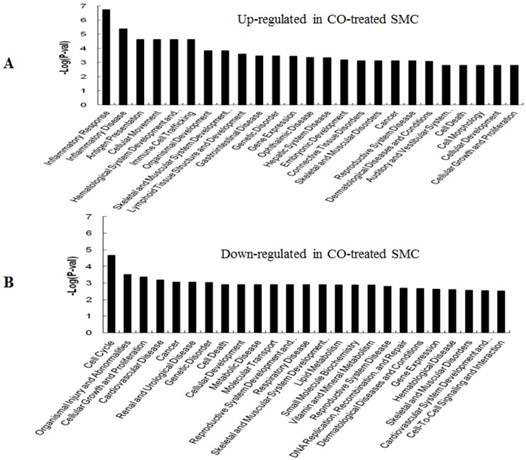
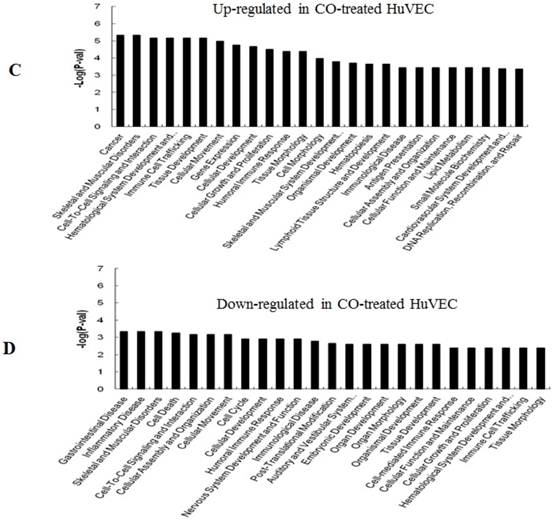
GO (gene ontology) analysis can identify over representation of GO categories, which can give insight into the mechanisms responsive to CO. The top 25 GO terms enriched in up- or down-regulated more than 1.5-fold change in CO-treated SMC and HuVEC compared with SMC and HuVEC (Fig. 6). We found that genes involved in inflammatory response, inflammatory disease, immune trafficking, genetic disorder, connective tissue disorder and skeletal and muscular disorder were significantly overrepresented among up-regulated genes in CO-treated SMC compared with SMC (Fig. 6A). It suggests that SMC appears immune response caused by biological functions disorder when exposure to CO. And most up-regulated genes in category of cellular growth and proliferation suppress cell growth in CO-treated SMC. However, down-regulated genes in category of cellular growth and proliferation affect cell growth in CO-treated SMC (Fig. 6B). Genes related to cell cycle, were also significantly down-regulated in CO-treated SMC (Fig. 6B), indicating that CO affected proliferative capability of SMC. Genes involved in cancer, skeletal muscular disorder and immune cell trafficking and humeral immune response were significantly overrepresented among up-regulated genes in CO-treated HuVEC compared with HuVEC (Fig. 6C). And most up-regulated genes in category of cellular growth and proliferation suppress cell growth in CO-treated HuVEC. Genes related to cell death, cell cycle, cell-to-cell signaling and interaction, cellular assembly and organization were also significantly down-regulated in CO-treated HuVEC (Fig. 6D).
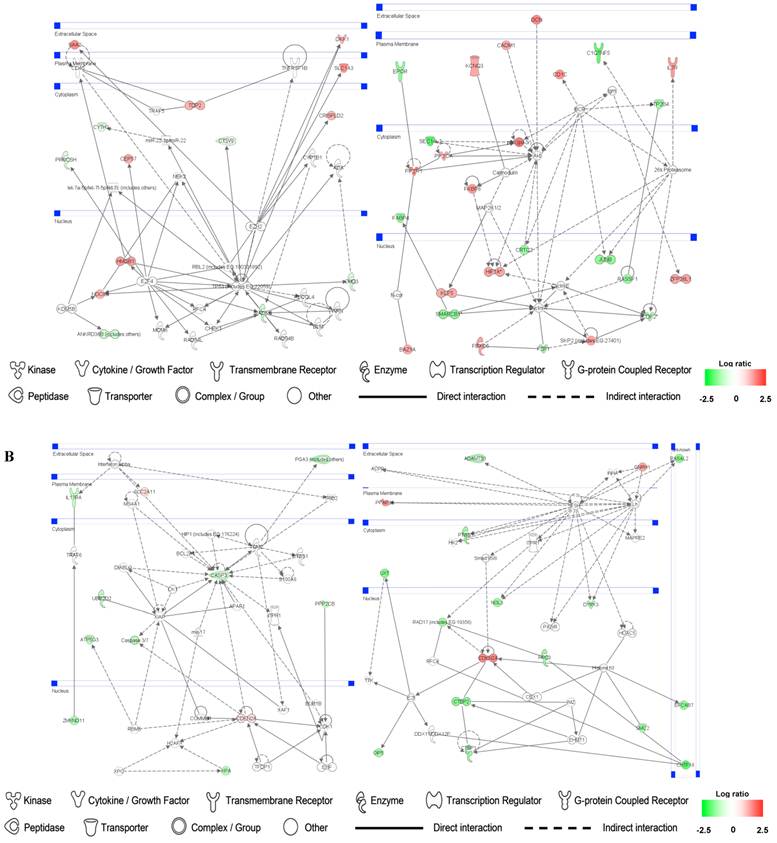
Identification of gene networks involved in SMC and HuVEC and treated with CO
Up- and down-regulated genes in the SMC, CO-treated SMC, HuVEC, CO-treated HuVEC comparisons were organized into interactome networks using IPA (Fig. 7). Fig. 7A shows network related to cell death, cell cycle, cell growth and proliferation in CO-treated SMC compared with SMC. Fig. 7B shows network related to cellular movement, cell death, cell growth and proliferation involved in CO-treated HuVEC compared with HuVEC.
Analysis on expression of cell proliferation and apoptosis associated genes
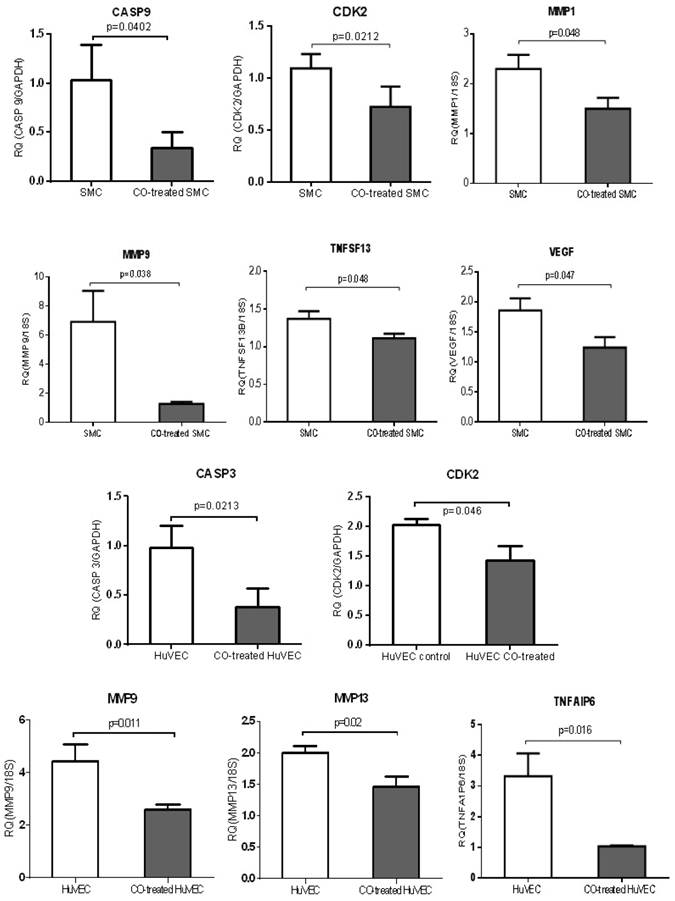
QPCR was used to validate a few of genes, including MMP family members, such as MMP1, MMP9 and MMP13, TNF members (TNFAIP6 and TNFSF13), apoptosis-associated genes, CASP3 and CASP9, growth-associated genes, CDK2 and VEGF. MMP1 and MMP9 were down-regulated in CO-treated SMC compared with control cell, while MMP9 and MMP13 were down-regulated in CO-treated HuVEC compared with HuVEC. Apoptosis associated genes, such as CASP9, TNFSF13 and CASP3 and TNFAIP6 were respectively down-regulated in SMC and HuVEC after CO exposure. Vascular endothelial growth factor (VEGF) was decreased in SMC after CO exposure. All data were shown in Fig.8.
Discussion
Recent studies have reported CO influences the properties of vascular SMC and epithelial cells, while the proliferation and apoptosis of vascular SMC and epithelial cells play an essential role during vasculogenesis and are closely associated with pathogenesis of numerous cardiovascular disorders, such as atherosclerosis, intimal hyperplasia, oxidative injury and pulmonary hypertension [12, 21, 22]. HO/CO pathway exerts an important effect on maintaining vascular homeostasis. For example, CO promotes blood fluidity by inhibiting the aggregation of platelets [23]. And the ability of CO to inhibit the proliferation and apoptosis of vascular cells will contribute to attenuating lesion formation at sites of vascular damage. Therefore, CO contributes to regulating the properties of vascular cells and has a utility perspective for circulation disease and organ implantation. In this study, we observed the role of CO in controlling vascular cells (SMC and HuVEC), and the results showed that exogenous CO arrested SMC and HuVEC growth by inhibiting cell cycle progress and reduced SMC and HuVEC apoptosis by corresponding signaling pathways.
Differentially expressed genes (fold change more than 1.5) between HuVEC and CO-treated HuVEC.
| Functional group Gene name | Gene symbol | Different expression CO treatment vs. control |
|---|---|---|
| TGF-β signaling | ||
| Mitogen-activated protein kinase kinase kinase 12 | MAP3K12 | DOWN |
| Smad family member 7 | SMAD7 | DOWN |
| Smad specific E3 ubiquitin protein ligase 1 | SMURF1 | DOWN |
| Cell proliferation and cell cycle | ||
| Cyclin-dependent kinase inhibitor 2a | CDKN2A | UP |
| Cyclin-dependent kinase 8 | CDK8 | DOWN |
| Histone deacetylase 8 | HDAC8 | DOWN |
| SHC transforming protein 1 | SHC1 | DOWN |
| Replication factor C 3 | RFC3 | DOWN |
| RAS p21 protein activator 2 | RASA2 | DOWN |
| Cell death and apoptosis | ||
| Tumor necrosis factor receptor superfamily, member 4 TNF receptor-associated factor 3 | TNFRSF4 TRAF3 | DOWN DOWN |
| Caspase 3, apoptosis-related cysteine peptidase | CASP3 | DOWN |
| Smad family member 7 | SMAD7 | DOWN |
| BCL2/adenovirus E1B 19kDa interacting protein 1 | BNIP1 | DOWN |
Top 25 GO terms enriched in up- or down-regulated more than 1.5-fold change in CO-treated SMC and HuVEC compared with SMC and HuVEC. (A) Top 25 GO terms enriched in up-regulated in CO-treated SMC compared with SMC. (B) Top 25 GO terms enriched in down-regulated in CO-treated SMC compared with SMC. (C) Top 25 GO terms enriched in up-regulated in CO-treated HuVEC compared with HuVEC. (D) Top 25 GO terms enriched in down-regulated in CO-treated HuVEC compared with HuVEC.
Gene networks involved in CO-treated SMC and HuVEC. Red and green respectively represent up-regulated and down-regulated genes in SMC and HuVEC after exposure to CO. The regulation extents are based on the color grade. (A) Network about cell death, cell cycle and cell growth involved in CO-treated SMC compared with SMC. (B) Network about cell death, cell cycle, cell growth and proliferation involved in CO-treated HuVEC compared with HuVEC.
CO treatment down-regulated the expression of some genes related to cell growth and apoptosis in SMC and HuVEC. The expressions of 6 genes (CASP9, CDK2, MMP1, MMP9, TNFSF13 and VEGF) were significantly down-regulated in CO-treated SMC compared to SMC. The expressions of 5 genes (CASP3, CDK2, MMP9, MMP13 and TNFAIP6) were significantly down-regulated in CO-treated HuVEC compared to HuVEC. RQ (relative quantity) in each bar represents the mean of 3 samples. Error bars denote SEM.
Other studies have reported that low concentration (50 to 500 ppm) of CO exerted a certain protective effect on the cells or in the animal model and had no adverse effect on cell viability [19, 24-28]. So in this study, we used 250 ppm of CO to treat SMC and HuVEC. Interesting, we found that SMC growth was obviously arrested after SMC exposed to CO for 5-day which are related to the expression of cell growth regulation genes, cyclins and cyclin dependent kinases. NGF and NGFRAP1 were down-regulated in CO-treated SMC compared with normal cultured SMC, which in turn may affect downstream signaling related to cell growth and production of cyclin D. And CO inhibited the expression of cyclin-dependent kinase inhibitor (p16), which consequently may regulate cyclin-dependent kinase 4 activity and affect the forming of cyclin D-CDK4 complex, which further disturbs Rb phosphorylation and inhibits G1/S transition at early stage. Furthermore, CDK2 was also down-regulated followed by CO exposure, and then would further reduce forming of cyclin E-CDK2 complex, which will inhibit G1/S-phase progress at late stage. Therefore, CO regulates SMC G1/S transition by selectively inhibiting the expression of p16 and CDK2. As for HuVEC, CO not only induced the expression of p16, but also inhibited the expression of CDK8, it may affect the formation of cyclin D-CDK4 complex, consequently blocks the transition from the G1 phase to the S phase [29]. Therefore, CO inhibits SMC and HuVEC growth by down-regulating the expression of cyclin-dependent kinases and cyclins to make SMC and HuVEC arrest at G1/S transition by partly mediating the p53/Rb signaling pathway.
Histones play a critical role in transcriptional regulation, cell cycle progression, and developmental events. Histone acetylation/deacetylation alters chromosome structure and affects transcription factor access to DNA. For example, myocyte enhancer factor 2 (MEF2) is related to cell growth and development. Lu et al reported that MEF2 mediated synergistic transcriptional responses to the CaMK and MAPK signaling pathways by signal-dependent dissociation from HDACs [30]. In the present study, our results demonstrated that up-regulation of MEF2 in SMC after CO exposure may cause SMC growth arrest. As for HuVEC, the down-regulation of histone deacetylase 8 (HDAC8) might inhibit HuVEC growth, effect of HDAC8 on cell proliferation has been reported in another study [31]. SHC transforming protein 1 (SHC1) binds to the IGF-1 receptor upon stimulation and becomes phosphorylated so that it can bind to GRB2 and activate the Ras/MAPK pathway that leads to cell proliferation [32]. SHC1 was down-regulated in SMC and HuVEC due to CO exposure, which may result in SMC and HuVEC growth arrest. Reduced expression of replication factor C 3 (RFC3) in HuVEC by CO may contribute to HuVEC growth arrest, one study proved the similar result [33].
Interestingly, CO also affected SMC and HuVEC apoptosis by regulating the expression of apoptosis-associated genes. For example, after SMC was exposed to CO, the expression of CASP9 was decreased, which is a member of caspase family of cysteine proteases that have been implicated in apoptosis [34]. In contrast, CO down-regulated CASP3 in HuVEC, CASP3 is also a member of caspase family that has implicated in apoptosis and is activated in the apoptotic cell both by extrinsic (such as TNF) and intrinsic pathways [35]. Another gene, Bcl2-antagonist/killer 1 (BAK1), in the presence of an appropriate stimulus, accelerates programmed cell death by binding to, and antagonizing the anti-apoptotic action of Bcl2. BAK is required to form pores in the mitochondrial outer membrane during apoptotic cell death [36]. The killing activity of BAK is regulated by other members of the Bcl2 family. After CO exposure, BAK1 in SMC was down-regulated, so it may block SMC apoptosis. We found that growth arrest-specific 1 (GAS1) was increased in CO-treated SMC. Gas1 is often increased expression in growth arrested cells and it is involved in cell growth suppression [37]. In addition, Gas1 is also associated with cell apoptosis [38]. So GAS1 not only mediates cell growth but also affects cell apoptosis.
PI3K can block cell apoptosis by regulating protein kinase B downstream molecule [39]. In this study, CO may inhibit SMC apoptosis by up-regulating PI3K. Moreover, TRAF3IP1 and TNFSF13 were down-regulated by CO in SMC, which might inhibit SMC apoptosis by NF-κB signaling pathway [40]. BMP2K was down-regulated in CO-treated SMC, while BMP2K stimulates apoptosis [41], so CO might inhibit SMC apoptosis by down-regulating BMP2K NF-κB signaling pathway. In HuVEC, we noticed that CASP3 and SMAD7 were down-regulated by CO, which may cause HuVEC apoptosis inhibition by TGF-β signaling [42]. Furthermore, we found MMP1, MMP9 and VEGF were down-regulated by CO exposure in SMC or HuVEC, so CO could also affect apoptosis and proliferation of SMC and HuVEC by regulating the expression of MMP1, MMP9 and VEGF which can modulate cell apoptosis and proliferation [43-45].
In addition, network analysis will provide new insights for investigating the effect of CO on vascular SMC and epithelial cells. Gene network analysis on CO-treated SMC, nearly half of the genes involved cell cycle, cell growth and proliferation or cell death were down-regulated. These findings indicate that CO inhibits SMC proliferation and apoptosis. For example, extracellular gene DKK1 was up-regulated by CO treatment. DKK1 consider to be a negative regulator of Wnt signaling and plays a crucial role in inducing apoptosis [46]. In gene network involved in CO-treated HuVEC, about 70% genes were down-regulated. Therefore, genes in these networks may have mutual influence and coordinate to regulate the proliferation and apoptosis of SMC or HuVEC by CO treatment.
Based on the above analysis, our results demonstrated that besides directly blocking SMC and HuVEC growth, CO also indirectly influenced cell apoptosis by regulating the expression of apoptosis-associated genes. Vascular cell apoptosis may contribute to the remodeling response after vascular vessel injury. CO may alleviate the extent of vascular cell injury by the prevention of vascular cell proliferation and apoptosis in local injury of the blood vessel wall. Therefore, delivering CO to sites of arterial damage may provide a novel therapeutic approach in ameliorating vascular damage diseases. The present study analyzed the mediating effect of CO on vascular SMC and HuVEC, including cell proliferation and apoptosis, and we hope the data could provide a hint for the further research.
Acknowledgements
We acknowledge the UT Southwestern Microarray Core for assistance with the Microarray. This research was supported by National Natural Science Foundation of China (31100924 to Y.L.), 100 Talents and Knowledge Innovation Program of the Chinese Academy of Sciences (to X.F.), National Key Scientific Instrument and Equipment Development Projects (2011YQ03013404 to X.F.), and Chinese Academy of Sciences Visiting Professorship for Senior International Scientists (2010T2S20 to E.K.W).
Conflict of Interests
The authors have declared that no conflict of interest exists.
References
1. Tenhunen R, Marver HS, Schmid R. The enzymatic conversion of heme to bilirubin by microsomal heme oxygenase. Proc Natl Acad Sci U S A. 1968;61:748-755
2. Choi AM, Dolinay T. "Therapeutic" carbon monoxide may be a reality soon. Am J Respir Crit Care Med. 2005;171:1318-1319
3. Motterlini R, Clark JE, Foresti R. et al. Carbon monoxide-releasing molecules: characterization of biochemical and vascular activities. Circ Res. 2002;90:E17-24
4. Otterbein LE, Soares MP, Yamashita K. et al. Heme oxygenase-1: unleashing the protective properties of heme. Trends Immunol. 2003;24:449-455
5. Chapman JT, Otterbein LE, Elias JA. et al. Carbon monoxide attenuates aeroallergen-induced inflammation in mice. Am J Physiol Lung Cell Mol Physiol. 2001;281:L209-216
6. Otterbein LE, Bach FH, Alam J. et al. Carbon monoxide has anti-inflammatory effects involving the mitogen-activated protein kinase pathway. Nat Med. 2000;6:422-428
7. Brouard S, Otterbein LE, Anrather J. et al. Carbon monoxide generated by heme oxygenase 1 suppresses endothelial cell apoptosis. J Exp Med. 2000;192:1015-1026
8. Morita T, Mitsialis SA, Koike H. et al. Carbon monoxide controls the proliferation of hypoxic vascular smooth muscle cells. J Biol Chem. 1997;272:32804-32809
9. Peyton KJ, Reyna SV, Chapman GB. et al. Heme oxygenase-1-derived carbon monoxide is an autocrine inhibitor of vascular smooth muscle cell growth. Blood. 2002;99:4443-4448
10. Ryter SW, Otterbein LE. Carbon monoxide in biology and medicine. Bioessays. 2004;26:270-280
11. Otterbein LE, Mantell LL, Choi AM. Carbon monoxide provides protection against hyperoxic lung injury. Am J Physiol. 1999;276:L688-694
12. Otterbein LE, Zuckerbraun BS, Haga M. et al. Carbon monoxide suppresses arteriosclerotic lesions associated with chronic graft rejection and with balloon injury. Nat Med. 2003;9:183-190
13. Zhang F, Kaide JI, Rodriguez-Mulero F. et al. Vasoregulatory function of the heme-heme oxygenase-carbon monoxide system. Am J Hypertens. 2001;14:62S-67S
14. Urquhart P, Rosignoli G, Cooper D. et al. Carbon monoxide-releasing molecules modulate leukocyte-endothelial interactions under flow. J Pharmacol Exp Ther. 2007;321:656-662
15. Brugger J, Schick MA, Brock RW. et al. Carbon monoxide has antioxidative properties in the liver involving p38 MAP kinase pathway in a murine model of systemic inflammation. Microcirculation. 2010;17:504-513
16. Jackson EB Jr, Mukhopadhyay S, Tulis DA. Pharmacologic modulators of soluble guanylate cyclase/cyclic guanosine monophosphate in the vascular system - from bench top to bedside. Curr Vasc Pharmacol. 2007;5:1-14
17. Christova T, Diankova Z, Setchenska M. Heme oxygenase--carbon monoxide signalling pathway as a physiological regulator of vascular smooth muscle cells. Acta Physiol Pharmacol Bulg. 2000;25:9-17
18. Liu XM, Chapman GB, Peyton KJ. et al. Antiapoptotic action of carbon monoxide on cultured vascular smooth muscle cells. Exp Biol Med (Maywood). 2003;228:572-575
19. Liu XM, Chapman GB, Peyton KJ. et al. Carbon monoxide inhibits apoptosis in vascular smooth muscle cells. Cardiovasc Res. 2002;55:396-405
20. Jaffe EA, Nachman RL, Becker CG. et al. Culture of human endothelial cells derived from umbilical veins. Identification by morphologic and immunologic criteria. J Clin Invest. 1973;52:2745-2756
21. Ishikawa K, Sugawara D, Wang X. et al. Heme oxygenase-1 inhibits atherosclerotic lesion formation in ldl-receptor knockout mice. Circ Res. 2001;88:506-512
22. Fujita T, Toda K, Karimova A. et al. Paradoxical rescue from ischemic lung injury by inhaled carbon monoxide driven by derepression of fibrinolysis. Nat Med. 2001;7:598-604
23. Wagner CT, Durante W, Christodoulides N. et al. Hemodynamic forces induce the expression of heme oxygenase in cultured vascular smooth muscle cells. J Clin Invest. 1997;100:589-596
24. Liu SH, Ma K, Xu B. et al. Protection of carbon monoxide intraperitoneal administration from rat intestine injury induced by lipopolysaccharide. Chin Med J (Engl). 2010;123:1039-1046
25. Queiroga CS, Tomasi S, Wideroe M. et al. Preconditioning Triggered by Carbon Monoxide (CO) Provides Neuronal Protection Following Perinatal Hypoxia-Ischemia. PLoS One. 2012;7:e42632
26. Wen Z, Liu Y, Li F. et al. Low dose of carbon monoxide intraperitoneal injection provides potent protection against GalN/LPS-induced acute liver injury in mice. J Appl Toxicol. 2012
27. Mahan VL, Zurakowski D, Otterbein LE. et al. Inhaled carbon monoxide provides cerebral cytoprotection in pigs. PLoS One. 2012;7:e41982
28. Lin LC, Ho FM, Yen SJ. et al. Carbon monoxide induces cyclooxygenase-2 expression through MAPKs and PKG in phagocytes. Int Immunopharmacol. 2010;10:1520-1525
29. John PC, Mews M, Moore R. Cyclin/Cdk complexes: their involvement in cell cycle progression and mitotic division. Protoplasma. 2001;216:119-142
30. Lu J, McKinsey TA, Nicol RL. et al. Signal-dependent activation of the MEF2 transcription factor by dissociation from histone deacetylases. Proc Natl Acad Sci U S A. 2000;97:4070-4075
31. He J, Liu H, Chen Y. Effects of trichostatin A on HDAC8 expression, proliferation and cell cycle of molt-4 cells. J Huazhong Univ Sci Technolog Med Sci. 2006;26:531-533
32. Ravichandran KS. Signaling via Shc family adapter proteins. Oncogene. 2001;20:6322-6330
33. Xia ST, Xiao LT, Bi DL. et al. Arabidopsis replication factor C subunit 1 plays an important role in embryogenesis. Zhi Wu Sheng Li Yu Fen Zi Sheng Wu Xue Xue Bao. 2007;33:179-187
34. Kuida K. Caspase-9. Int J Biochem Cell Biol. 2000;32:121-124
35. Agosto M, Azrin M, Singh K. et al. Serum caspase-3 p17 fragment is elevated in patients with ST-segment elevation myocardial infarction: a novel observation. J Am Coll Cardiol. 2011;57:220-221
36. Takahashi A, Masuda A, Sun M. et al. Oxidative stress-induced apoptosis is associated with alterations in mitochondrial caspase activity and Bcl-2-dependent alterations in mitochondrial pH (pHm). Brain Res Bull. 2004;62:497-504
37. Del Sal G, Ruaro ME, Philipson L. et al. The growth arrest-specific gene, gas1, is involved in growth suppression. Cell. 1992;70:595-607
38. Spagnuolo R, Corada M, Orsenigo F. et al. Gas1 is induced by VE-cadherin and vascular endothelial growth factor and inhibits endothelial cell apoptosis. Blood. 2004;103:3005-3012
39. Jeong SJ, Dasgupta A, Jung KJ. et al. PI3K/AKT inhibition induces caspase-dependent apoptosis in HTLV-1-transformed cells. Virology. 2008;370:264-272
40. Lee HY, Youn SW, Kim JY. et al. FOXO3a turns the tumor necrosis factor receptor signaling towards apoptosis through reciprocal regulation of c-Jun N-terminal kinase and NF-kappaB. Arterioscler Thromb Vasc Biol. 2008;28:112-120
41. Kimura N, Matsuo R, Shibuya H. et al. BMP2-induced apoptosis is mediated by activation of the TAK1-p38 kinase pathway that is negatively regulated by Smad6. J Biol Chem. 2000;275:17647-17652
42. Okado T, Terada Y, Tanaka H. et al. Smad7 mediates transforming growth factor-beta-induced apoptosis in mesangial cells. Kidney Int. 2002;62:1178-1186
43. Wise LM, Inder MK, Real NC. et al. The vascular endothelial growth factor (VEGF)-E encoded by orf virus regulates keratinocyte proliferation and migration and promotes epidermal regeneration. Cell Microbiol. 2012
44. Chintala SK, Zhang X, Austin JS. et al. Deficiency in matrix metalloproteinase gelatinase B (MMP-9) protects against retinal ganglion cell death after optic nerve ligation. J Biol Chem. 2002;277:47461-47468
45. Conant K, St Hillaire C, Nagase H. et al. Matrix metalloproteinase 1 interacts with neuronal integrins and stimulates dephosphorylation of Akt. J Biol Chem. 2004;279:8056-8062
46. Hirata H, Hinoda Y, Nakajima K. et al. Wnt antagonist DKK1 acts as a tumor suppressor gene that induces apoptosis and inhibits proliferation in human renal cell carcinoma. International Journal of Cancer. 2011;128:1793-1803
Author contact
![]() Corresponding author: Dr. Quanzhen Li, Department of Immunology and Internal Medicine, University of Texas Southwestern Medical Center, Dallas, TX. Tel: 214-645-6073; Fax:214-645-6074. Email: quan.liedu. Address: 6001 Forest Park Rd./ND6.504 Dallas, Texas 75390-8814, USA. Or Dr. Xiangdong Fang, Laboratory of Disease Genomics and Individualized Medicine, Beijing Institute of Genomics, Chinese Academy of Sciences, Beijing, China. Tel: 86-10-82995408, Fax: 86-10-82995401. Email: fangxdac.cn. Address: No.7, Beitucheng West Road, Chaoyang District, Beijing, 100029, China.
Corresponding author: Dr. Quanzhen Li, Department of Immunology and Internal Medicine, University of Texas Southwestern Medical Center, Dallas, TX. Tel: 214-645-6073; Fax:214-645-6074. Email: quan.liedu. Address: 6001 Forest Park Rd./ND6.504 Dallas, Texas 75390-8814, USA. Or Dr. Xiangdong Fang, Laboratory of Disease Genomics and Individualized Medicine, Beijing Institute of Genomics, Chinese Academy of Sciences, Beijing, China. Tel: 86-10-82995408, Fax: 86-10-82995401. Email: fangxdac.cn. Address: No.7, Beitucheng West Road, Chaoyang District, Beijing, 100029, China.
Received 2012-5-29
Accepted 2012-11-8
Published 2012-11-17