ISSN: 1449-2288International Journal of Biological Sciences
- Current issue
- Volume 20; 2024
- Volume 19; 2023
- Volume 18; 2022
- Volume 17; 2021
- Volume 16; 2020
- Archive
- Advance articles
- Cover images
- Index & coverage
- Cover suggestion
- Special issues
1. Introduction
2. Materials and Methods
3. Results
4. Discussion
5. Conclusions
Abbreviations
Acknowledgements
References
Authors Biographies
ANNEXES

Int J Biol Sci 2009; 5(7):706-726. doi:10.7150/ijbs.5.706 This issue Cite
Research Paper
A Comparison of the Effects of Three GM Corn Varieties on Mammalian Health
Joël Spiroux de Vendômois1, François Roullier1, Dominique Cellier1,2, Gilles-Eric Séralini1,3 ![]()
1. CRIIGEN, 40 rue Monceau, 75008 Paris, France
2. University of Rouen LITIS EA 4108, 76821 Mont-Saint-Aignan, France
3. University of Caen, Institute of Biology, Risk Pole CNRS, EA 2608, 14032 Caen, France
Abstract
We present for the first time a comparative analysis of blood and organ system data from trials with rats fed three main commercialized genetically modified (GM) maize (NK 603, MON 810, MON 863), which are present in food and feed in the world. NK 603 has been modified to be tolerant to the broad spectrum herbicide Roundup and thus contains residues of this formulation. MON 810 and MON 863 are engineered to synthesize two different Bt toxins used as insecticides. Approximately 60 different biochemical parameters were classified per organ and measured in serum and urine after 5 and 14 weeks of feeding. GM maize-fed rats were compared first to their respective isogenic or parental non-GM equivalent control groups. This was followed by comparison to six reference groups, which had consumed various other non-GM maize varieties. We applied nonparametric methods, including multiple pairwise comparisons with a False Discovery Rate approach. Principal Component Analysis allowed the investigation of scattering of different factors (sex, weeks of feeding, diet, dose and group). Our analysis clearly reveals for the 3 GMOs new side effects linked with GM maize consumption, which were sex- and often dose-dependent. Effects were mostly associated with the kidney and liver, the dietary detoxifying organs, although different between the 3 GMOs. Other effects were also noticed in the heart, adrenal glands, spleen and haematopoietic system. We conclude that these data highlight signs of hepatorenal toxicity, possibly due to the new pesticides specific to each GM corn. In addition, unintended direct or indirect metabolic consequences of the genetic modification cannot be excluded.
Keywords: GMO, toxicity, GM corn, rat, NK 603, MON 810, MON 863
1. Introduction
There is a world-wide debate concerning the safety and regulatory approval process of genetically modified (GM) crops and foods [1, 2]. In order to scientifically address this issue, it is necessary to have access to toxicological tests, preferably on mammals, performed over the longest time-scales involving detailed blood and organ system analyses. Furthermore, these tests should, if possible, be in accordance with OECD guidelines. Unfortunately, this has been a challenge since usually these are regulatory tests performed confidentially by industry prior to commercialization of their GM crops, pesticides, drugs or chemicals. As a result, it is more instructive to investigate the available data that allows comparisons of several GMOs consumptions on health effects. This will allow the most appropriate statistical analyses to be performed in order to avoid possible false positive as well as false negative results. The physiological criteria used to either accept or reject any GM significant effect as relevant should be made clear. Here we discuss sex-related, temporal, linear and non-linear dose effects which are often involved in the establishment of chronic and endocrine diseases.
We investigated three different GM corn namely NK 603, MON 810 and MON 863, which were fed to rats for 90 days. The raw data have been obtained by European governments and made publically available for scrutiny and counter-evaluation. These studies constitute a model to investigate possible subchronic toxicological effects of these GM cereals in mammals and humans. These are the longest in vivo tests performed with mammals consuming these GMOs. The animals were monitored for numerous blood and organ parameters. One corn (NK 603) has been genetically engineered to tolerate the broad spectrum herbicide Roundup and thus contains residues of this formulation. The two other types of GM maize studied produce two different new insecticides namely modified versions of Cry1Ab (MON 810) and Cry3Bb1 (MON 863) Bacillus thuringiensis-derived proteins. Therefore, all these three GM maize contain novel pesticide residues that will be present in food and feed. As a result, the potential effects on physiological parameters, due either to the recognized mutagenic effects of the GM transformation process or to the presence of the above mentioned novel pesticides within these plants can be evaluated in animal feeding studies.
2. Materials and Methods
2.1. Experimental design
The three animal feeding studies were conducted in two different laboratories and at two different dates; at Monsanto (Missouri, USA) for NK 603 and MON 810 (June 7, 2000) and at Covance Laboratories Inc. (Virginia, USA) for MON 863 (March 14, 2001) on behalf of Monsanto. The young adult male and female rats, approximately 4-6 week-old, were of the Sprague-Dawley albino strain Crl:CD(SD)IGS BR®, (obtained from Charles River Laboratories Inc., NY, USA). The animals (400 per GMO; 200 for each sex) were randomized for similar body weight distribution. In fact, there were only two treated groups for each sex (20 animals each consuming specific GM maize feed). Only 10 rats were measured per group for blood and urine parameters and served as the basis for the major statistical analyses conducted. In addition, the investigators claimed that OECD guidelines and standards were followed. For each type of GM maize, only two feeding doses were tested per sex. This consisted of either 11 or 33% GM maize in an otherwise equivalent equilibrated diet; that is when the diet contained only 11% GM maize, the difference was made up by adding 22% non-GM maize (varieties not indicated). There were also two comparative control groups fed diets containing similar quantities of the closest isogenic or parental maize variety. Furthermore, groups of animals were also fed with diets containing one of six other normal (non-GM) reference maize lines; the same lines for the NK 603 and MON 810 tests, but different types for the MON 863 trials. We note that these unrelated, different non-GM maize types were not shown to be substantially equivalent to the GMOs. The quantity of some sugars, ions, salts, and pesticide residues, do in fact differ from line to line, for example in the non-GM reference groups. This not only introduced unnecessary sources of variability but also increased considerably the number of rats fed a normal non-GM diet (320) compared to the GM-fed groups (80) per transformation event, which considerably unbalances the experimental design. A group consisting of the same number of animals fed a mixture of these test diets would have been a better and more appropriate control. In addition, no data is shown to demonstrate that the diets fed to the control and reference groups were indeed free of GM feed.
2.2. Data collection
The raw biochemical data, necessary to allow a statistical re-evaluation, should be made publically available according to European Union Directive CE/2001/18 but unfortunately this is not always the case in practice. On this occasion, the data we required for this analysis were obtained either through court actions (lost by Monsanto) to obtain the MON 863 feeding study material (June 2005), or by courtesy of governments or Greenpeace lawyers. We thank the Swedish Board of Agriculture, May 30, 2006 for making public the NK 603 data upon request from Greenpeace Denmark and lawyers from Greenpeace Germany, November 8, 2006 for MON 810 material. This allowed us to conduct for the first time a precise and direct side-by-side comparison of these data from the three feeding trials with these GMOs.
Approximately 80 different biochemical and weight parameters, including crude and relative measures (Table A, Annexes), were evaluated in serum and urine after 5 and 14 weeks of feeding. We classified these per organ (markers by site of synthesis or regulation). These organs weighed at the end of the experimental period, along with the whole body were: adrenal glands, brain, gonads, heart, kidneys, liver, and spleen. In addition, some parameters measured were related to bone marrow (blood cells) and pancreas (glucose) function. Unfortunately, some important measurements serving as markers for liver function were not conducted for technical or unknown reasons. This included gamma glutamyl transferase after 90 days feeding, cholesterol and triglyceride levels in the NK 603 and MON 810 trials, and cytochrome P450 family members in all cases. In addition, important sex difference markers were also ignored such as blood sex or pituitary hormone levels. Furthermore, it is well known and present in OECD guidelines that measurements should be conducted for at least 3 different experimental points to study dose- or time-related effects. Contrastingly and for reasons that are not stated, in all three studies for all three GMOs, only 2 doses and periods of feeding were measured, which makes it difficult to evaluate dose and cumulative effects. We have in a first instance indicated lacking values for different parameters (Annexes, Tables B, C, D).
2.3. Statistical power related to the experimental design
The most fundamental point to bear in mind from the outset is that a sample size of 10 for biochemical parameters measured two times in 90 days is largely insufficient to ensure an acceptable degree of power to the statistical analysis performed and presented by Monsanto. For example, concerning the statistical power in a t test at 5%, with the comparison of 2 samples of 10 rats, there is 44% chance to miss a significant effect of 1 standard deviation (SD; power 56%). In this case to have a power of 80% would necessitate a sample size of 17 rats. Therefore, the statistical power is insufficient in these studies to allow an a priori dismissal of all significant effects. Indeed, this is true overall with the amplitude of the effects that can usually be observed within three months, in the case of usual chronic toxicity appearing after one year of treatment. Hence, the lack of rejection of the null hypothesis at 5% does not mean that this hypothesis is true. Thus, the assessment of statistical power is absolutely necessary to understand the undetectable size effect; the statistical power depends on the sample and effect size, and the level of the test. This is exemplified when Monsanto performed one-way analysis of variance (ANOVA) calculations at 5% with a sample size of 10 animals for 10 groups. In this case the probability of not detecting a medium size effect [3] (0.5 SD for a t test for instance) is about 70% (power of the test 30%). However, the fact is that within 90 days, a chronic toxicity has a maximum chance of giving rise to a medium rather than large size effects. The disturbance of parameters at the beginning of a disease is generally less important than at its end or as time progresses. Therefore, the protocol has to be drastically improved at this level, and as a result we consider that based on the analysis as presented by Monsanto that it fails to demonstrate that the consumption of these GM maize feeds was indeed safe as claimed. Any sign of toxicity should be taken into consideration to justify the prolongation of the experiment, or, if this is not possible, to reassess the statistical analysis, and to propose a scientifically valid physiological interpretation of any findings relating to disturbed functional parameters on a per organ basis. This was the ultimate objective of this investigation.
In reality, in their report containing the raw data and statistical analysis, Monsanto did not apply in any case their chosen and described statistical methods. Only parametric tests (one-way ANOVA under homoscedasticity hypothesis and Student t tests on contrasts) were employed. Moreover, to select significant results, they only contrasted the data sets from the 33% GM maize feeding groups (for NK 603 and MON 810) with all reference groups. Moreover, their biological interpretation of statistically significant results differs from case to case. In particular, sex differences were frequently used to reject pathological significance, despite the fact that this was without measuring effects on sex hormone levels. They also used the lack of linear dose-related effects, which is almost inevitable given that only two feeding doses were measured, to declare the diet as safe, as proposed for MON 863 GM maize [4]. In the MON 863 experiments, the authors still failed to apply their declared methodology, which was slightly different. The ANOVA and contrast analysis (33% GM feeding dose versus controls) were in this case the determining criteria for evaluation of statistical significance, but only if the mean of the 33% GM feeding group was outside the range of the mean of the reference cohorts. All this increases noticeably the risks of false negative results.
Consequently, based on the clear inadequacy of the statistical power used to refute toxic effects (for instance the unquestionable large size effects in this study), knowing also that billions of people and animals can consume these products prior to the performance of appropriate in vivo safety evaluation, we applied an appropriate, experimentally validated statistical analytical methodology [5], elements of which are described below.
2.4. Statistical methods employed
We first repeated the same statistical analysis as conducted by Monsanto to verify descriptive statistics (sample size, means, and standard deviation) and ANOVA per sex, per variable and for each of the three GMO. For all that, the normality of the residues was tested using the Shapiro test and the homoscedasticity (homogeneity of the variances) using the Bartlett test. In the case where the Shapiro and Bartlett tests were non significant (*p > 0.05 and **p > 0.01, respectively) we performed an ANOVA [6, 7], and in the case of heteroscedasticity the approximate Welch method was used. In the case where the Shapiro test was significant, we performed the Kruskal-Wallis rank sum test [7, 8].
We then analyzed the effects of the GM maize varieties on each sex and each diet by pairwise comparisons of the parameters of GM-fed rats versus control groups, and subsequently to the unrelated non-GM maize reference groups. The statistical differences between reference and control groups were calculated in order to study the effects of the different normal diets per se (due to differences in salts, sugars, minerals, vitamins, pesticides, etc composition), and indicated by contrast to Monsanto's work (see legend Table 1). In order to select the appropriate two-tailed comparison test [7], we again studied first normality (Shapiro test) and variance equality (F test). According to the results, we performed the adapted test; that is, an unpaired t test, a Welch corrected t test or a Mann-Whitney test (which is generally more appropriate with a sample size of 10). To perform multiple pairwise comparisons, we used the False Discovery Rate approach (FDR, [9]) to calculate adjusted p-values, in order to limit the rate of false positives to 5%. We preferred Benjamini and Yekutieli's method [10] rather than that of Benjamini and Hochberg [11] as the parameters under investigation are not independent. In addition, after centering and scaling the data, Principal Components Analysis (PCA, [12]) was performed in order to study the scattering of the different factors (sex, period, diet, dose and group). Finally, we established per group for each rat and by parameter the representations and paired tests corresponding to the temporal changes between the two feeding periods.
We used the R language [7] version 2.5 for all statistical computations [13] with the appropriate package: pwr package for power studies, the bioconductor's multtest package for FDR [14-15] and the ADE4 package [16, 17] for multivariate analysis.
3. Results
We have previously reported indications of toxicity in rats fed with MON 863 GM maize for 90 days [5]. However, these signs of toxicity alone do not constitute proof of adverse health effects. We have therefore extended our initial analysis on the MON 863 feeding data by collectively compiling the significant differences observed in the physiological and biochemical parameters measured in feeding trials of rats with each of the three GM maize varieties MON 863, MON 810 and NK 603 (Tables 1, 2; Annex Table E). When we then initially compare all p-values in our calculations with those of Monsanto (significant and non significant differences, Annex Table E), we obtain ratios of 432/452 (NK 603), 435/450 (MON 810) and 442/470 (MON 863). By employing our statistical methods even if we reached a concordance with Monsanto's results (Annex Table E), the level of precision of the main effects and their interpretation are highly different. Therefore, we then progressed to consider only relative differences over 5% (Tables 1 and 2).
3.1. NK 603
We first evaluated the results for the NK 603 feeding trials. The observations shown in Table 1 with relative differences versus controls reveal that of 23 significantly different effects that are supposed to be due to this GM maize, 18 are in males (raw means with SEM; Annex Table F). The repartition of effects is thus sex-dependent. In addition, in general liver (Fig. 1) and kidney (Fig. 2) parameters in all rats are sex differentially expressed. This is evident not only in the experiments involving NK 603, independently of the treatment at week 14, but also at week 5 (data not shown), but similarly observed in the MON 810 and MON 863 feeding tests (Annex Fig. A- Fig. D).
Males are clearly more sensitive than female animals to show physiological disturbances when fed NK 603. This is not observed for all three GM maize varieties. Moreover, most effects appear to be dose-dependent since 83% of male effects emerge only at the 33% feeding level (15/18), the highest GM maize concentration in the diet (Table 1). The maximal mean differences are observed in male kidney parameters.
Urine phosphorus, for instance, is importantly disturbed in a dose-dependent manner and at both 5 and 14 week periods of feeding and hence reproducible over time. The significant effect at this level does not appear to be a false positive result (week 5, 33%, adjusted p<0.003 for FDR calculated according to Benjamini and Yekutieli), considering that all parameters were not independent. Comparable results were also obtained for relative lymphocyte and neutrophil differences (all for males, week 14, 33%, adjusted p<0.005).
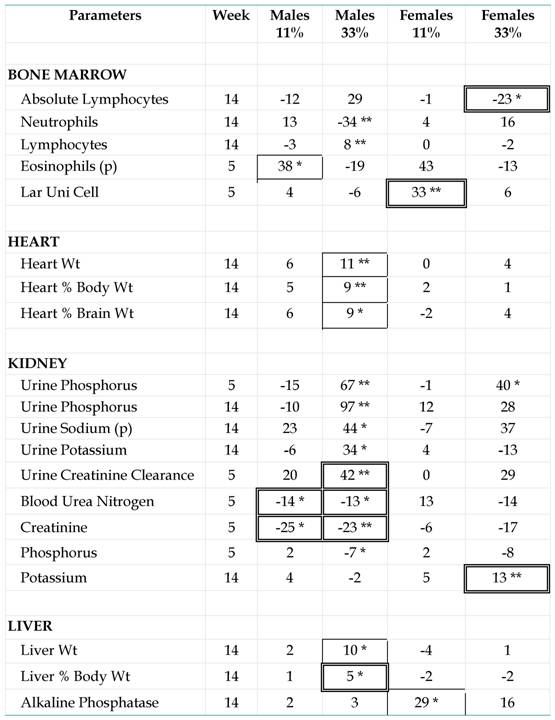
Differences between NK 603-fed rats and controls. Study of the GMO effects, which are indicated by mean differences (%) for each parameter with the corresponding control group per sex and per dose. The significant differences versus controls (*p < 0.05, **p < 0.01), for all the parameters measured in the subchronic feeding tests, are presented. The parameters were grouped by organs according to the sites of synthesis or classical indicators of dysfunction. They were indicated for all groups only if they showed at least for one sex or one diet a significant and relatively ± 5% difference to the mean. The animals were male (m) or female (f) young adult rats fed during 5 or 14 weeks with the GM maize NK 603 (11 or 33% in the diet) and compared with controls fed with a ''substantially equivalent'' isogenic maize line. The parameters were measured for 10 rats, except for the organ weights (20 rats), obtained only at the end of the experiment. In single-boxed numbers, we indicate the statistical differences between GMO-fed rats and controls, which are not found between the mean of the six reference groups and controls. A difference between reference and control groups could indicate an effect of the diet per se. In double-boxed numbers, among the effects due to the GMO, are indicated the statistical differences between the GMO groups and the mean of the six reference groups (which have not even eaten a genetically linked variety of maize as the control and the GMO treated groups). (p): Differences for the indicated parameters are not significant by a nonparametric test but by a parametric one; all other differences by both. “Lar Uni Cell” means percent of large unnucleated cell count.
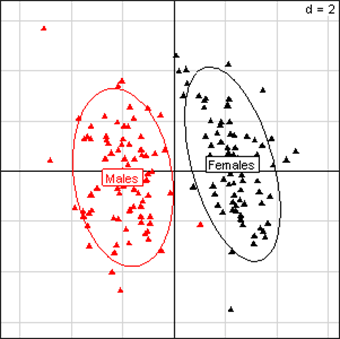
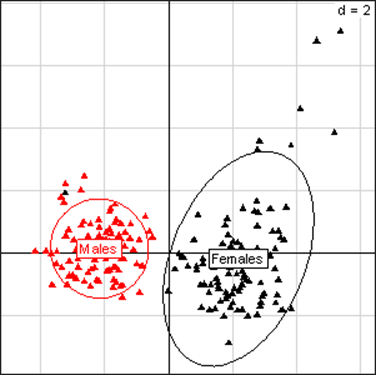
Principal Component Analysis for liver parameters of all rats in the NK 603 feeding trial. The scheme obtained for parameters at week 14 explains 66.65% of the total data variability (inertia) expressed on 2 axes (49.84% for factor 1; 16.81% for factor 2), scale d=2. This demonstrates the clear separation of parameters values according to sex.
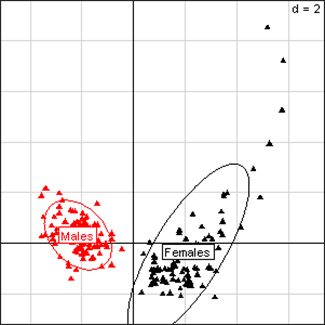
Principal Component Analysis for kidney parameters of all rats in the NK 603 experiment. The scheme obtained for parameters at week 14 explains 44.78% of the total data variability (inertia) expressed on 2 axes (27.27% for factor 1; 17.51% for factor 2), scale d=2. This demonstrates the clear separation of parameters values according to sex.
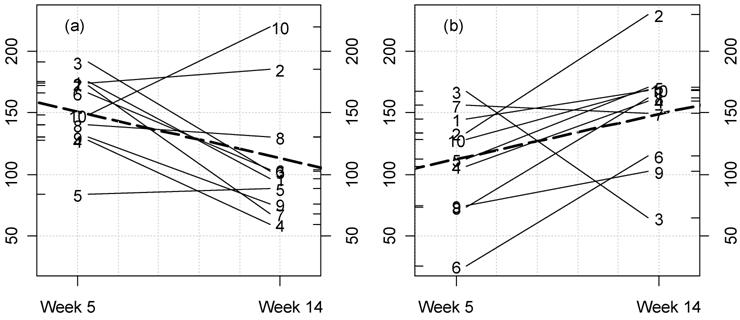
Among 18 GM maize-related effects versus controls, 11 show that groups of reference and control animals are similar in these cases (Table 1, framed values). However 6 GM-linked effects are also significant versus all reference groups (Table 1, double framed values). At week 5, these relative maximal effects concern a diminution of blood and increase of urine creatinine clearance, and then a diminution of blood urea nitrogen. This is not observed at week 14 (Fig. 3a,b). Even so, the kidney parameters measured are clearly the most reactive in both sexes; 52% of significant effects are noticed at this level, but kidney parameters represent only 31% of those measured in total. We also observe that ion concentrations are enhanced in urine of male GM fed rats. Besides this, crude and relative liver weights are also affected at the end of the maximal (33%) GM maize feeding level as well as that of the heart which for corresponding parameters to a comparable extent, showed up to an 11% weight increase. Variations in females are far less frequent (5/23), with no clear significant differences except for urine phosphorus (major relative difference versus controls) and blood potassium (versus all groups).
3.2. MON 810
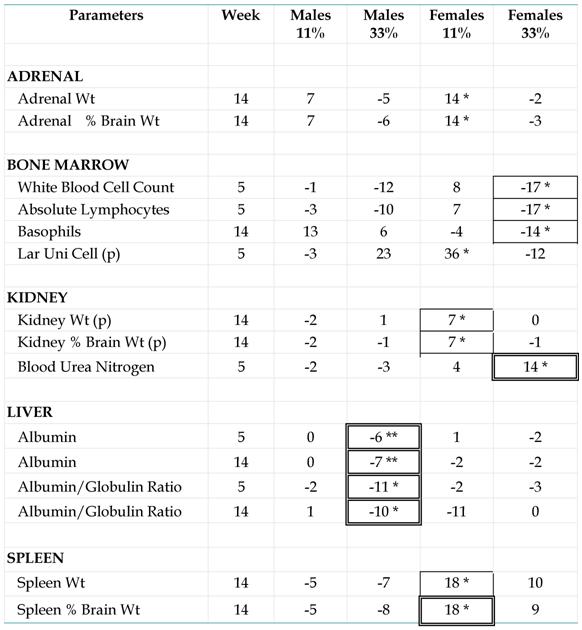
Feeding of MON 810 resulted in 11/15 significant effects in females (Table 2, crude means with SEM; Annex Table G), which again highlights sex-differential effects. The sex-dependency for the measured parameters in liver and kidney is observed for all rats (Annex Fig. A & Fig. B). The significant GM-maize linked effects are generally detected either after 14 weeks of consumption or at a high GM feed dose in the diet. Parameters affected relate to: blood cells, adrenal gland and kidney weights, an increase in blood urea nitrogen and higher spleen weight. Significantly disturbed parameters in males are concentrated in liver function at the 33% GM-maize feeding level in the diet, with a slight diminution in general serum albumin production. All disturbances are <20% and p-values are significant but >1% (Table 2, starred values). However, p-values adjusted for FDR are not significant.
Differences between MON 810-fed rats and controls. For details, see legend Table 1.
3.3. MON 863
We have already described our evaluation of the MON 863 rat feeding studies [5]. Sex-dependency is well marked in this case also for the spreading of all parameters in liver and kidney (Annex Fig. C & Fig. D). The 34 significant GM-linked effects are equally distributed among males (16) and females (18). This contrasts with what is observed with NK 603 and MON 810. Nevertheless, 9/16 (56%) of males show statistically significant differences in kidney compared to 4/18 females. However, although kidney parameters represent only 37.5% of all measurements, these data show a male-specific effect in kidney function. This trend is somewhat opposite to what is seen in liver parameters where males showed significant effects in 5/16 cases whereas the rate is 9/18 in females. Male rats also appear more sensitive to kidney disturbances at the higher GM feeding dose (11 effects at 33% versus 5 at 11%).
Additional statistically significant differences include (i) a serum glucose and triglyceride increase (up to 40%) in females versus controls, together with a higher liver (7%) and overall body (3.7%) weight, (ii) elevated creatinine, blood urea nitrogen and urine chloride excretion in females, but greater variation in male kidney function (creatinine, and in urine sodium, potassium and phosphorus), (iii) up to a significant kidney weight decrease (7%) with a noticeable chronic nephropathy in males [18], (iv) a decrease (3.3%) in male body weights and (v) some liver function differences in males (albumin, globulin, as in females, plus alanine aminotransferase), although none of the FDR-adjusted p-values are significant.
Furthermore, we have also measured in this study for the first time the differences between time-related variations (at weeks 5 and 14) for this GM maize variety, at each feeding dose versus controls. We have represented these variations for each rat for all parameters. Among these, the significant variations corresponding to disturbed parameters are illustrated (Figs. 4-7). Our analysis clearly shows that female rat triglyceride levels vary between 5 and 14 weeks of feeding (Fig. 4; p=0.025). Triglyceride levels increase over time within the GM maize feeding group and whilst decreasing in the case of controls. Again in females, the increase in creatinine caused by MON 863 is more evident with longer feeding periods at an 11% level (Fig. 5; p=0.022). Another significant difference (p=0.011), which we observe is a reciprocal variation in female urine chloride excretion (Fig. 6). In the males, only urine potassium decreases over time with the consumption of GM feed but increases in controls (Fig. 7, p=0.011).
In summary, the tendency for physiological disturbance is characteristic of almost all rats of all GM-fed treatment groups, and physio-pathological profiles differ according to dose or sex.
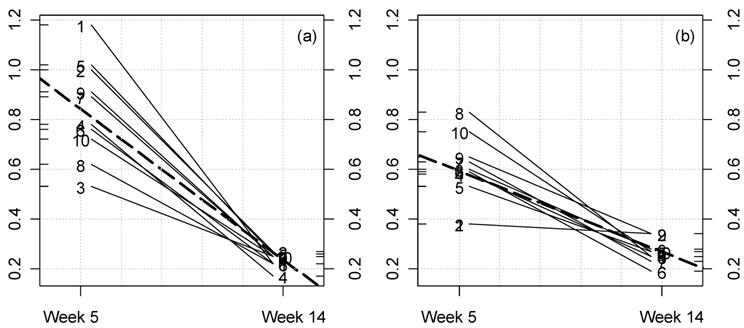
Kinetic plot for urine creatinine clearance in male rats fed NK 603. For each rat at 33% GM maize feed level (a) and controls (b) the lines represent the variations between week 5 and 14 for this parameter (ml/min/100 g body weight). The dotted thick line represents the means variation.
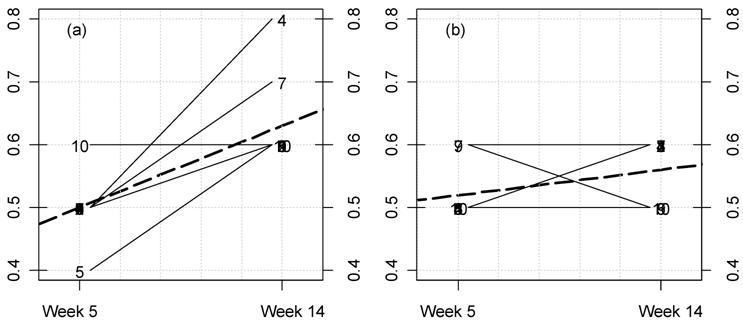
Kinetic plot for female rat triglyceride levels in the MON 863 feeding trial. For each rat at 11% GM maize feed level (a) and controls (b) the lines represent the variations between week 5 and 14 for this parameter (mg/dL). The dotted thick line represents the mean variation.
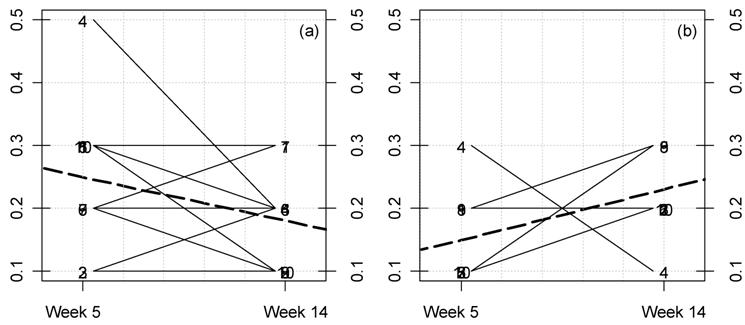
Kinetic plot for creatinine levels in female rats fed MON 863. For each rat at 11% GM maize feeding level (a) and controls (b) the lines represent the variations between week 5 and 14 for this parameter (mg/dL). The dotted thick line represents the mean variation.
Kinetic plot for urine chloride excretion in female rats fed MON 863. For each rat at 33% GM feed level (a) and controls (b) the lines represent the variations between week 5 and 14 for this parameter (meq/time). The dotted thick line represents the mean variation.
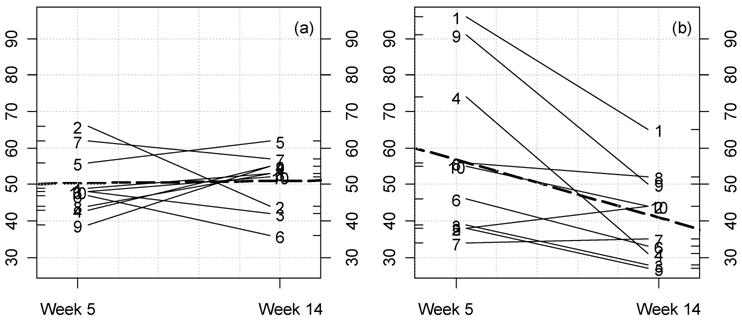
Kinetic plot for urine potassium in male rats fed MON 863. For each rat at 11% GM maize level (a) and controls (b) the lines represent the variations between week 5 and 14 for this parameter (mmol/L). The dotted thick line represents the mean variation.
4. Discussion
If a “sign of toxicity” may only provoke a reaction, pathology or a poisoning, a so-called “toxic effect” is without doubt deleterious on a short or a long term. Clearly, the statistically significant effects observed here for all three GM maize varieties investigated are signs of toxicity rather than proofs of toxicity, and this is essentially for three reasons. Firstly, the feeding trials in each case have been conducted only once, and with only one mammalian species. The experiments clearly need to be repeated preferably with more than one species of animal. Secondly, the length of feeding was at most only three months, and thus only relatively acute and medium-term effects can be observed if any similar to what can be derived in a process such as carcinogenesis [19, 20] or after endocrine disruption in adults [21]. Proof of toxicity is hard to decide on the basis of these conditions. Longer-term (up to 2 years) feeding experiments are clearly justified and indeed necessary. This requirement is supported by the fact that cancer, nervous and immune system diseases, and even reproductive disorders for examples can become apparent only after one or two years of a given intervention treatment under investigation, but they will not be evident in all cases after three months of administration when first signs of toxicity may be observed [22, 23]. In addition, large effects (e.g. 40% increase in triglycerides) in all likelihood will be missed with the protocol of the current studies, since they are limited by the number of animals used in each feeding group and by the nature of the parameters studied. Thirdly, the statistical power of the tests conducted is low (30%) because the experimental design of Monsanto (see Materials and Methods). However, it is important to note that these short-term (3-month) rat feeding trials are the only tests conducted on the basis of which regulators determine whether these GM crop/food varieties are as safe to eat as conventional types. Given that these GM crops are potentially eaten by billions of people and animals world-wide, it is important to discuss whether the experimental design, the statistical analyses and interpretations originally undertaken are appropriate and sufficient.
Any differences observed in comparison with the isogenic variety, has to be taken into account as a potential physiological disruption. This is particularly valid since any statistically differences that are observed are highly unlikely to be arising from population variation as in the case of humans due to the genetic homogeneity of the rat strain used in these studies. Moreover, the standardized conditions of rat maintenance employed, which are stated to be in accordance with OECD standards [24, 25], make the diet the only factor of variation in the protocol. Thus, the GM maize component of the test diet is the major factor of difference if one directly compares treated rats and controls. This is indicated by stars in the Tables expressing the total characteristics of GM-linked physio-pathological profiles. The other results that are encompassed by frames in the Tables highlight that effects from the GM maize are over and above those observed for any of the six different diets; for instance, over that observed with a diet richer in salt or sugar over the 3-month feeding period. These additional “control” diets could have been avoided with an experimental design that truly focused on the general question of GM toxicity.
The first observation that we were able to make was that there is a good general concordance between our data and the results of Monsanto as presented in their original confidential reports, in particular on the proportion of statistically significant observations. However, the methodology we employed revealed different effects, which completely changed the interpretation of the experimental results. For instance, the sex differences are fully taken into account in our study, which contrasts with the first published comments of these data [18, 26, 27]. We evaluated and took note of differences in the reaction of male and female rats to the GM maize test diets based on accepted and now classical knowledge of endocrinology [28], embryology [29, 30], physiology [31, 32], enzymology or hepatology [33] demonstrating sex-specific physio-pathological effects. Indeed, our present results fully confirmed the sex-specific distribution of effects on kidney and liver parameters for all rats in all three studies analyzed here. An identical effect in both sexes would have been exceptional, like with strong or acute toxicity. This is obviously not the case here. In addition, we considered equally important effects that were neither time nor dose related, even if we detailed these when observed in the results. The proof for a linear dose dependency, as requested by Doull and coll. [4] to determine the significance of effects, is impossible with only two feeding points with no prior standardization. Furthermore, a metabolic reaction either physiological or pathological is not necessarily linear in its response [34, 35]. Again, this does not invalidate a description of effects appearing at the higher GM feed doses.
Even if the significant differences are around 5% of all comparisons for each GM corn, we believe that they either constitute a very good possibility to represent signs of toxicity, or at the very least should be considered as sufficiently strong evidence to justify a repeat of the experiments incorporating longer feeding times, for several reasons. Firstly, the arguments of Hammond and coll. [18, 26, 27] from Monsanto and Doull and co-workers [4] cannot demonstrate that the statistically significant GM-feed linked differences are not physiologically relevant [2]. Secondly, very few GM-feed effects appear only at the low dose or after the shortest (5 week) feeding period; 8.6% for NK 603, 6.6% for MON 810, 14.7% for MON 863 (Tables 1, 2, and ref. [5]). Thirdly, the marked sex difference effects observed for the GM maize feeding groups, in several instances, are found for physiological markers in all rats. Therefore, there is little probability that these effects were a random, chance occurrence. Fourthly, our stringent statistical tools allowed differentiation of GM-feed impacts from differences arising from variation in the composition of other reference diet. This is the first time that such an analysis has been conducted. Fifthly, there is a lack of cancer, hormonal or hepatic functional marker measurements (for example, oncogene expression, sex steroid hormone levels, cytochrome P450 levels), that could have provided explanatory insight into the results. The lack of availability of this type of data may be of benefit to those that doubt the current observations provide evidence of potential signs of toxicity. Sixthly, the physiological and biochemical parameters found to be disrupted in these feeding studies frequently provide a coherent, GM-specific picture of events, which corresponds and is in support of the generally admitted concept held by industry and regulators that GM crops and food should be considered on a case by case basis. Seventhly, several double-framed outcomes encompass all dietary effects only after the 3 month period of feeding. Last but not least, the most marked and most numerous effects are on organs involved in detoxification like the kidney and liver, usually reached after a diet-linked toxicity.
For instance in the NK 603 study statistically significant strong urine ionic disturbances and kidney markers imply renal leakage. This includes creatinine (increased urinary clearance), together with its diminution in the blood, and the decrease in urea nitrogen. Blood creatinine reduction has in some cases been found to be associated with muscle problems. It is therefore perhaps of note that the heart, as a very representative muscle organ was affected in the GM feeding groups. The possibility of renal porosity as evidenced by these data may be due to the presence of residues of Roundup herbicide, that are present in GM crop varieties such as the NK 603 maize investigated here. We have previously demonstrated that glyphosate-based herbicides such as Roundup are highly toxic at very low concentrations to human embryonic kidney cells [36], inducing a decrease in viability, noticeably via inhibition of mitochondrial succinate dehydrogenase.
The deficiency in kidney function we highlight to be present in male rats is different between animals fed NK 603 and MON 863. The latter is characterized by an increase in plasma creatinine levels and retention of ions, which were associated with a chronic interstitial nephropathy, as originally admitted in the Monsanto MON 863 report and by Hammond and coll. [18]. However, this disturbance in kidney function was dismissed in their conclusions because the strain of rat used in the feeding studies is apparently sensitive to this type of pathology, especially during aging, which was not the case here. However, this reasoning was admitted by various regulatory authorities (EFSA, CGB in France). These arguments again appear flawed as the rats were still relatively young, 5 months by the end of the experimental period and therefore below the age when they might be expected to spontaneously develop kidney diseases. More importantly, these kidney effects are clearly MON 863-specific since they are not observed with all three GM maize varieties and the control groups, and therefore could not have arisen from an inherent genetic predisposition of the strain of rat used, which in addition was the same in all cases. Overall, no kidney parameters in male animals are disrupted in the MON 810 feeding group, even though sensitivity to toxics appears in general to be greater in this sex [37, 38]. An additional contributory factor to this disturbance in kidney function could arise from either novel unintended toxic effect caused by the inherent mutagenic effect of the GM technology, or possibly due to the new mutant forms of Bt toxin produced by MON 863, which is completely different from that engineered into MON 810. However, MON 810-fed females have a slight kidney weight enhancement, which may correspond with a mild hyperplasia usually seen in association with immune inflammatory processes. A re-evaluation of the histological slides from these animals would be of interest to test this hypothesis. Furthermore, analysis of some pertinent markers of kidney function such as arterial tension or angiotensin levels are lacking from these studies. This type of investigation including controls where animals are fed a normal diet spiked with the corresponding purified Bt toxin, would allow a more rational and precise interpretation of the results.
In the case of the MON 863 feeding trials, which have previously been discussed [5] and are at the center of a debate [2, 4], new results have been obtained by the re-evaluation of the data with more powerful statistical methods as we present here. In female rats, there is a risk of becoming pre-occupied with the reactions already ascribed to the GM feeding group since several parameters indicate increases in circulating glucose and triglyceride levels, with liver function parameters disrupted together with a slight increase in total body weight [5]. This physiological state is indicative of a pre-diabetic profile. We demonstrate here that in female animals triglycerides profile, creatinine or urine chloride excretion are differentially and specifically altered over time in comparison to control groups, depending on the GMO dose. All these disruptions and differences taken together could be interpreted as clear signs of toxicity.
The effects found after only 5 weeks of feeding or at lower 11% feed dose, cannot be neglected simply on the basis that they are less frequently observed. Compensation or recuperation could occur after tissues are harmed, as possibly observed in the case of mice fed a diet containing Roundup Ready GM soy [39]. Peak inflammatory processes may occur in damaged tissues, followed by a regeneration phase as observed after bacteria/viral infection or a chemical toxic insult [40, 41]. For instance, urine potassium decreases in male rats over time in the GM MON 863 group at the 11% feed dose, which was not observed in all but one of the controls. This effect is specifically time-dependent and thus does not appear to be artefactual. This type of punctual regeneration may be part of a carcinogenic process, and clearly even if total recovery occurs, this should not be taken as a sign that the GM feed is safe.
5. Conclusions
Patho-physiological profiles are unique for each GM crop/food, underlining the necessity for a case-by-case evaluation of their safety, as is largely admitted and agreed by regulators. It is not possible to make comments concerning any general, similar subchronic toxic effect for all GM foods. However, in the three GM maize varieties that formed the basis of this investigation, new side effects linked to the consumption of these cereals were revealed, which were sex- and often dose-dependent. Effects were mostly concentrated in kidney and liver function, the two major diet detoxification organs, but in detail differed with each GM type. In addition, some effects on heart, adrenal, spleen and blood cells were also frequently noted. As there normally exists sex differences in liver and kidney metabolism, the highly statistically significant disturbances in the function of these organs, seen between male and female rats, cannot be dismissed as biologically insignificant as has been proposed by others [4]. We therefore conclude that our data strongly suggests that these GM maize varieties induce a state of hepatorenal toxicity. This can be due to the new pesticides (herbicide or insecticide) present specifically in each type of GM maize, although unintended metabolic effects due to the mutagenic properties of the GM transformation process cannot be excluded [42]. All three GM maize varieties contain a distinctly different pesticide residue associated with their particular GM event (glyphosate and AMPA in NK 603, modified Cry1Ab in MON 810, modified Cry3Bb1 in MON 863). These substances have never before been an integral part of the human or animal diet and therefore their health consequences for those who consume them, especially over long time periods are currently unknown. Furthermore, any side effect linked to the GM event will be unique in each case as the site of transgene insertion and the spectrum of genome wide mutations will differ between the three modified maize types. In conclusion, our data presented here strongly recommend that additional long-term (up to 2 years) animal feeding studies be performed in at least three species, preferably also multi-generational, to provide true scientifically valid data on the acute and chronic toxic effects of GM crops, feed and foods. Our analysis highlights that the kidneys and liver as particularly important on which to focus such research as there was a clear negative impact on the function of these organs in rats consuming GM maize varieties for just 90 days.
Abbreviations
GM: genetically modified; m: modified toxin by mutagenesis.
Acknowledgements
We thank Michael Antoniou for assistance and comments on the compilation of this manuscript. The support of the French Ministry of Research is gratefully acknowledged.
Greenpeace contributed to the start of the investigations by funding first statistical analyses in 2006, the results were then processed further and evaluated independently by the authors.
Conflict of Interests
The authors declare that there is no conflict of interest.
References
1. Konig A, Cockburn A, Crevel RWR. et al. Assessment of the safety of foods derived from genetically modified (GM) crops. Food Chem Toxicol. 2004;42:1047-88
2. Séralini GE, Spiroux de Vendômois J, Cellier D. et al. How subchronic and chronic health effects can be neglected for GMOs, pesticides or chemicals. Int J Biol Sci. 2009;5:438-43
3. Cohen J. Statistical power analysis for the behavioral sciences. Hillsdale, USA: Lawrence Erlbaum Associates Publisher. 1988
4. Doull J, Gaylor D, Greim HA. et al. Report of an Expert Panel on the reanalysis by Séralini et al. (2007) of a 90-day study conducted by Monsanto in support of the safety of a genetically modified corn variety (MON 863). Food Chem Toxicol. 2007;45:2073-85
5. Séralini GE, Cellier D, Spiroux de Vendômois J. New analysis of a rat feeding study with a genetically modified maize reveals signs of hepatorenal toxicity. Arch Environ Contam Toxicol. 2007;52:596-602
6. Chambers JM, Freeny A, Heidelberger RM. Analysis of variance; design experiments in statistical models. London, UK: Wadsworth & Brooks/Cole. 1992
7. Crawley MJ. Statistics an introduction using R. London, UK: Wiley. 2005
8. Hollander M, Wolfe DA. Nonparametric statistical inference. In: John Wiley & sons, ed, New York. 1973:115-20
9. Shaffer JP. Multiple hypothesis testing. Annu Rev Psychol. 1995;46:561-84
10. Benjamini Y, Yekutieli D. The control of the false discovery rate in multiple hypothesis testing under dependency. The Annals of Statistics. 2001;29:1165-88
11. Benjamini Y, Hochberg Y. Controlling the false discovery rate: a practical and powerful approach to multiple testing. JRSSB. 1995;57:289-300
12. Hotelling H. Analysis of a complex of statistical variables into principal components. J Educ Psychol. 1933;24:417-41
13. Comprehensive R Archive Network, CRAN. http://cran.r-project.org
14. Bioinformatics and Computational Biology Solutions Using R and Bioconductor; Series: Statistics for Biology and Health. 2005 Gentleman RC, Carey VJ, Huber W, et al. http://www.springer.com/series/2848
15. 2004. Katherine S, et al. http://bioconductor.org
16. Thioulouse J, Chessel D, Dolédec S. et al. ADE-4: a multivariate analysis and graphical display software. Statistics and Computing. 1996;7:75-83
17. Chessel D, Dufour AB, Thioulouse J. The ade4 package-I- One-table methods. R News. 2004;4:5-10
18. Hammond B, Lemen J, Dudek R. et al. Results of a 90-day safety assurance study with rats fed grain from corn rootworm-protected corn. Food Chem Toxicol. 2006;44:147-60
19. Farber E. Cancer development and its natural history a cancer prevention perspective. Cancer. 1988;62:1676-79
20. Chakraborty T, Chatterjee A, Rana A. et al. Carcinogen-induced early molecular events and its implication in the initiation of chemical hepatocarcinogenesis in rats: Chemopreventive role of vanadium on this process. Biochim Biophys Acta. 2007;1772:48-59
21. Vos JG, Dybing E, Greim H A. et al. Health effects of endocrine-disrupting chemicals on wildlife, with special reference to the European situation. Crit Rev Toxicol. 2000;30:71-133
22. Clarke J, Hurst C, Martin P. et al. Duration of chronic toxicity studies for biotechnology-derived pharmaceuticals: Is 6 months still appropriate. Regul Tox Pharmacol. 2008;50:2-22
23. EFSA GMO Panel. Safety and nutritional assessment of GM plants and derived food and feed: the role of animal feeding trials. Food Chem Toxicol. 2008;46(Suppl 1):S2-70
24. OECD: Safety evaluation of foods derived by modern biotechnology: Concepts and principles; Paris, France: 1993. http://www.oecd.org
25. OECD: Report of the workshop on the toxicological and nutritional testing of novel foods. SG/ICGB(98)1.1997. http://www.oecd.org
26. Hammond B, Dudek R, Lemen J. et al. Results of a 13 week safety assurance study with rats fed grain from glyphosate tolerant corn. Food Chem Toxicol. 2004;42:1003-14
27. Hammond BG, Dudek R, Lemen JK. et al. Results of a 90-day safety assurance study with rats fed grain from corn borer-protected corn. Food Chem Toxicol. 2006;44:1092-9
28. Reinisch JM, Ziemba-Davis M, Sanders SA. Hormonal contributions to sexually dimorphic behavioral development in humans. Psychoneuroendocrinology. 1991;16:213-78
29. Agras K, Willingham E, Shiroyanagi Y. et al. Estrogen receptor-alpha and beta are differentially distributed, expressed and activated in the fetal genital tubercle. J Urol. 2007;177:2386-92
30. Grimm VE, Frieder B. Differential vulnerability of male and female rats to the timing of various perinatal insults. Int J Neurosci. 1985;27:155-64
31. Toufexis D. Region- and sex-specific modulation of anxiety behaviours in the rat. J Neuroendocrinol. 2007;19:461-73
32. Weinberg J, Sliwowska JH, Lan N. et al. Prenatal alcohol exposure: foetal programming, the hypothalamic-pituitary-adrenal axis and sex differences in outcome. J Neuroendocrinol. 2008;20:470-88
33. Lupp A, Hugenschmidt S, Rost M. et al. Influence of recipient gender on intrasplenic fetal liver tissue transplants in rats: cytochrome P450-mediated monooxygenase functions. Toxicology. 2004;197:199-212
34. Goldsmith JR, Kordysh E. Why dose-response relationships are often non-linear and some consequences. J Expo Anal Environ Epidemiol. 1993;3:259-76
35. Calabrese EJ, Baldwin LA. Hormesis: U-shaped dose responses and their centrality in toxicology. Trends Pharmacol Sci. 2001;22:285-91
36. Benachour N, Sipahutar H, Moslemi S. et al. Time- and dose-dependent effects of roundup on human embryonic and placental cells. Arch Environ Contam Toxicol. 2007;53:126-33
37. Iliescu R, Yanes LL, Bell W. et al. Role of the renal nerves in blood pressure in male and female SHR. Am J Physiol Regul Integr Comp Physiol. 2006;290:R341-44
38. Attia DM, Goldschmeding R, Attia MA. et al. Male gender increases sensitivity to renal injury in response to cholesterol loading. Am J Physiol Renal Physiol. 2003;284:F718-26
39. Malatesta M, Baldelli B, Battistelli S. et al. Reversibility of hepatocyte nuclear modifications in mice fed on genetically modified soybean. Eur J Histochem. 2005;49:237-42
40. Mehendale HM. Mechanism of the lethal interaction of chlordecone and CCl4 at non-toxic doses. Toxicol Lett. 1989;49:215-41
41. Pickart L. The human tri-peptide GHK and tissue remodeling. J Biomater Sci Polym Ed. 2008;19:969-88
42. Latham JR, Wilson AK, Steinbrecher RA. The Mutational Consequences of Plant Transformation. J Biomed Biotech. 2006;25376:1-7
Authors Biographies
Prof. Gilles-Eric Séralini is a molecular biologist at the University of Caen, team leader and author of books on environment and GMOs. He was expert for the French government (1998-2007) and the European Union at the WTO level and for the council of Ministers on GMOs (2003, 2008), president of the scientific council for independent research on genetic engineering (CRIIGEN), and receiver of Order of Merit for his scientific career (2008). Correspondence: criigen@unicaen.fr
Dr. Joël Spiroux de Vendômois is doctor in medicine, specialist in environmental pathologies and co-organizer of the first European meeting on environmental pathologies.
François ROULLIER is a statistician.
Dr. Dominique CELLIER is a researcher in bioinformatics, co-organizer of a Master 2 in bioinformatics and statistics at the University of Rouen.
ANNEXES
Parameters as measured by Monsanto in subchronic toxicological studies in rats, sorted by organs. * data available only for MON 863; ** raw data not analyzed by Monsanto for MON863; # data available only for NK 603 and MON 810; ## raw data lacking in the original NK 603 and MON 810 reports from Monsanto, ? non understandable lack of data.
| Parameters (total 83) | Units | Weeks | Abbreviations |
|---|---|---|---|
| Body Weight (Wt) | g | 14 | TBWEIGHT |
| Adrenal (3) | |||
| Adrenal Wt | g | 14 | ADRENAL |
| Adrenal % Body Wt | % | 14 | ADRENAL_%Body |
| Adrenal % Brain Wt | % | 14 | ADRENAL_%Brain |
| Brain (2) | |||
| Brain Wt | g | 14 | BRAIN |
| Brain % Body Wt | % | 14 | BRAIN_%Body |
| Bone marrow (22) | |||
| White Blood Cell | x10E3/ µL | 5, 14 | WBC |
| Platelet Count | x10E3/ µL | 5, 14 | PLT |
| Absolute Neutrophils | x10E3/ µL | 5, 14 | ABS_NEUT |
| Absolute Lymphocytes | x10E3/ µL | 5, 14 | ABS_LYMPH |
| Absolute Monocytes | x10E3/ µL | 5, 14 | ABS_MONO |
| Absolute Eosinophils | x10E3 /µL | 5, 14 | ABS_EOS |
| Absolute Basophils | x10E3/ µL | 5, 14 | ABS_BASO |
| Absolute Lar Uni Cell # | x10E3/ µL | 5, 14 | ABS_LUC |
| Neutrophils ** | % | 5, 14 | NEUT |
| Lymphocytes ** | % | 5, 14 | LYMPH |
| Monocytes ** | % | 5, 14 | MONO |
| Eosinophils ** | % | 5, 14 | EOS |
| Basophils ** | % | 5, 14 | BASO |
| Lar Uni cell # | % | 5, 14 | LUC |
| Red Blood Cell | x10E6 µL | 5, 14 | RBC |
| Hemoglobin Conc. | g/dL | 5, 14 | HGB |
| Hematocrit | % | 5, 14 | HCT |
| Mean Corpuscular Vol. | fL | 5, 14 | MCV |
| Mean Corpuscular Hgb | pg | 5, 14 | MCH |
| Mean Corpuscular Hgb Conc. | g/dL | 5, 14 | MCHC |
| Absolute Reticulocyte Count * | x10E3/ µL | 5, 14 | ABS_RETIC |
| Reticulocyte Count * | %RBC | 5, 14 | RETIC |
| Liver (17) | |||
| Liver Wt | g | 14 | LIVER |
| Liver % Body Wt | % | 14 | LIVER_%Body |
| Liver % Brain Wt | % | 14 | LIVER_%Brain |
| Albumin | g/dL | 5, 14 | ALBUMIN |
| Globulin | g/dL | 5, 14 | GLOBULIN |
| Albumin/Globulin Ratio | - | 5, 14 | A/G_RATIO |
| Alanine Aminotransferase | U/L | 5, 14 | SGPT_ALT |
| Aspartate Aminotransferase | U/L | 5, 14 | SGOT_AST |
| Alkaline Phosphatase /AMP | U/L | 5, 14 | ALKPHOS |
| Total Protein | g/dL | 5, 14 | TOT_PROTEIN |
| Gamma Glutamyl Transferase | U/L | 5, ? | GAMMA_GT |
| Total Bilirubin | mg/dL | 5, 14 | TOT_BILI |
| Direct Bilirubin | mg/dL | 5, 14 | DIR_BILI |
| Cholesterol * | mg/dL | 5, 14 | CHOLEST |
| Triglycerides * | mg/dL | 5, 14 | TRIGLY |
| Individual Prothrombin Time | seconds | 14 | PT |
| Activated Partial Thromboplastin Time | seconds | 14 | APTT |
| Heart (3) | |||
| Heart Wt | g | 14 | HEART |
| Heart % Body Wt | % | 14 | HEART_%Body |
| Heart % Brain Wt | % | 14 | HEART_%Brain |
| Kidney (25) | |||
| Kidney Wt | g | 14 | KIDNEY |
| Kidney % Body Wt | % | 14 | KIDNEY_%Body |
| Kidney % Brain Wt | % | 14 | KIDNEY_%Brain |
| Urine Calcium | mg/dL | 5, 14 | U_CALCIUM |
| Urine Creatinine | mg/dL | 5, 14 | U_CREAT |
| Urine Protein | mg/dL | 5, 14 | U_PROTEIN |
| Urine Phosphorus | mg/dL | 5, 14 | U_PHOS |
| Urine Sodium | mmol/L | 5, 14 | U_SODIUM |
| Urine Potassium | mmol/L | 5, 14 | U_POTASSIUM |
| Urine Chloride | mmol/L | 5, 14 | U_CHLORIDE |
| Urine Creatinine Clearance # | mL/min/100 g body wt | 5, 14 | U_CREAT_Clear |
| Urine Sodium Excretion * | meq/time | 5, 14 | U_SOD_excr |
| Urine Potassium Excretion * | meq/time | 5, 14 | U_POT_excr |
| Urine Chloride Excretion * | meq/time | 5, 14 | U_CHLOR_excr |
| Total Urine Volume | mL/ collection period | 5, 14 | U_TOTALVOL |
| NA/K Ratio | - | 5, 14 | U_NA/K_RATIO |
| Blood Urea Nitrogen | mg/dL | 5, 14 | BUN |
| Calcium | mg/dL | 5, 14 | CALCIUM |
| Creatinine | mg/dL | 5, 14 | CREAT |
| Phosphorus | mg/dL | 5, 14 | PHOS |
| Sodium | mmol/L | 5, 14 | SODIUM |
| Potassium | mmol/L | 5, 14 | POTASSIUM |
| Chloride | mmol/L | 5, 14 | CHLORIDE |
| PH ## | U PH | 5, 14 | U_PH |
| Specific Gravity ## | U SG | 5, 14 | U_SG |
| Pancreas (1) | |||
| Glucose | mg/dL | 5, 14 | GLUCOSE |
| Gonads (6) | |||
| Testis Wt | g | 14 | TESTIS |
| Testis % Body Wt | % | 14 | TESTIS_%Body |
| Testis % Brain Wt | % | 14 | TESTIS_%Brain |
| Ovary Wt | g | 14 | OVARY |
| Ovary % Body Wt | % | 14 | OVARY_%Body |
| Ovary % Brain Wt | % | 14 | OVARY_%Brain |
| Spleen (3) | |||
| Spleen Wt | g | 14 | SPLEEN |
| Spleen % Body Wt | % | 14 | SPLEEN_%Body |
| Spleen % Brain Wt | % | 14 | SPLEEN_%Brain |
Values lacking in the NK603 subchronic toxicological feeding studies in rats. Except for two deceased rats (*) for which organs were not weighed nor biochemical parameters measured, the data lacking were generally unexplained by Monsanto. The number of the group of 20 rats each is indicated first, followed by two dots and the treatment (GMO, or isogenic line as control Ctrl, and unrelated reference group number among the 6 used as refX), as well as the sex, male (m) or female (f).
| Parameter | Group | Sex | Week | Dose (%) | Rat number | ||
|---|---|---|---|---|---|---|---|
| Urine | 1:GMO | m | 5 | 11 | 14 | ||
| 5: ref1 | m | 5 | 33 | 18 | |||
| 7: ref3 | m | 5 | 33 | 2 | |||
| 1:GMO | m | 14 | 11 | 18 | |||
| 4: Ctrl | m | 14 | 33 | 1 | |||
| 7: ref3 | m | 14 | 33 | 6 | |||
| 10:ref6 | m | 14 | 33 | 16 | |||
| 7: ref3 | f | 5 | 33 | 1 | |||
| 1:GMO | f | 14 | 11 | 2 | |||
| 1:GMO | f | 14 | 11 | 6 | |||
| 3: Ctrl | f | 14 | 11 | 14 | |||
| 4: Ctrl | f | 14 | 33 | 6 | |||
| 4: Ctrl | f | 14 | 33 | 16 | |||
| 5: ref1 | f | 14 | 33 | 11 | |||
| 5: ref1 | f | 14 | 33 | 14 | |||
| 5: ref2 | f | 14 | 33 | 6 | |||
| 5: ref3 | f | 14 | 33 | 17 | |||
| 5: ref3 | f | 14 | 33 | 18 | |||
| 5: ref4 | f | 14 | 33 | 16 | |||
| 5: ref5 | f | 14 | 33 | 18 | |||
| Hematology | 4: Ctrl | m | 14 | 33 | 14 | ||
| 6: ref2 | f | 5 | 33 | 14 | |||
| 8: ref4 | f | 5 | 33 | 11 | |||
| 9: ref5 | f | 5 | 33 | 11 | |||
| 2:GMO | f | 14 | 33 | 1 | |||
| 4: Ctrl | f | 14 | 33 | 17 | |||
| Organ weights | 2:GMO | m | 14 | 33 | 13* | ||
| 6: ref2 | m | 14 | 33 | 9* | |||
Values lacking in MON 810 subchronic toxicological feeding studies in rats. Except for one deceased rat (*) for which organs are not weighted nor biochemical parameters measured, the data lacking were generally unexplained by Monsanto. See legend Table B.
| Parameter | Group | Sex | Week | Dose (%) | Rat number |
|---|---|---|---|---|---|
| Urine | 5: ref1 | m | 5 | 33 | 18 |
| 7: ref3 | m | 5 | 33 | 2 | |
| 3: Ctrl | m | 14 | 11 | 8 | |
| 7: ref3 | m | 14 | 33 | 6 | |
| 10:ref6 | m | 14 | 33 | 16 | |
| 1:GMO | f | 5 | 11 | 9 | |
| 3: Ctrl | f | 5 | 11 | 18 | |
| 7: ref3 | f | 5 | 33 | 1 | |
| 3: Ctrl | f | 14 | 11 | 2 | |
| 3: Ctrl | f | 14 | 11 | 18 | |
| 5: ref1 | f | 14 | 33 | 2 | |
| 5: ref1 | f | 14 | 33 | 11 | |
| 5: ref1 | f | 14 | 33 | 14 | |
| 6: ref2 | f | 14 | 33 | 6 | |
| 7: ref3 | f | 14 | 33 | 17 | |
| 7: ref3 | f | 14 | 33 | 18 | |
| 8: ref4 | f | 14 | 33 | 16 | |
| 9: ref5 | f | 14 | 33 | 18 | |
| Hematology | 1: GMO | m | 5 | 11 | 3 |
| 2: GMO | m | 5 | 33 | 3 | |
| 6: ref2 | f | 14 | 33 | 14 | |
| 8: ref4 | f | 14 | 33 | 11 | |
| 9: ref5 | f | 14 | 33 | 11 | |
| Organ weights | 6: ref2 | m | 14 | 33 | 9* |
Values lacking in MON 863 subchronic toxicological feeding studies in rats. See legend Table B.
| Parameter | Group | Sex | Week | Dose (%) | Rat number |
|---|---|---|---|---|---|
| Urine | 2 :GMO | m | 14 | 33 | B38667 |
| 5 : ref1 | m | 14 | 33 | B38685 | |
| 8 : ref4 | m | 14 | 33 | B38743 | |
| 5 : ref1 | f | 14 | 33 | B38884 | |
| 5 : ref1 | f | 14 | 33 | B38890 | |
| 6 : ref2 | f | 14 | 33 | B38907 | |
| 6 : ref2 | f | 14 | 33 | B38911 | |
| 7 : ref3 | f | 14 | 33 | B38923 | |
| 7 : ref3 | f | 14 | 33 | B38925 | |
| 9 : ref5 | f | 14 | 33 | B38962 | |
| 9 : ref5 | f | 14 | 33 | B38965 | |
| 9 : ref5 | f | 14 | 33 | B38967 | |
| 10 :ref6 | f | 14 | 33 | B38989 | |
| Hematology | 8 : ref4 | m | 14 | 33 | B38749 |
| 2 :GMO | m | 14 | 33 | B38667 | |
| 6 : ref1 | m | 14 | 33 | B38711 | |
| 10 :ref6 | m | 14 | 33 | B38788 | |
| 2 :GMO | m | 14 | 33 | B38667 | |
| 3 : ctrl | f | 14 | 11 | B38809 | |
| 1 :GMO | f | 14 | 11 | B38845 | |
| 7 : ref3 | f | 14 | 33 | B38923 | |
| 9 : ref5 | f | 14 | 33 | B38967 | |
| Organ weights | 2 :GMO | m | 14 | 33 | B38667 |
| 7 : ref3 | f | 14 | 33 | B38923 | |
| 9 : ref5 | f | 14 | 33 | B38967 |
Concordances between Monsanto (M) and present CRIIGEN (C) statistical analysis. The total significant (signif.) and non significant (non signif.) effects measured by p values for each GM corn treatment are detailed.
| M C | Signif. | non signif. | total |
|---|---|---|---|
| NK 603 | |||
| signif. | 24 | 5 | 29 |
| non signif. | 15 | 408 | 423 |
| total | 39 | 413 | 452 |
| MON 810 | |||
| signif. | 15 | 4 | 19 |
| non signif. | 11 | 420 | 431 |
| total | 26 | 424 | 450 |
| MON 863 | |||
| signif. | 23 | 15 | 38 |
| non signif. | 13 | 419 | 432 |
| total | 36 | 434 | 470 |
NK 603: Effects of GM feed treatment classified by organ type. Based on Table 1, all the parameters statistically significant different between GM corn fed rats and corresponding controls are represented by their crude means ± SEM in exact corresponding units. The differences were always p < 0.05 or < 0.01 compared to controls according to one or two asterisks in Table 1. The symbol (p) means that the difference is significant only in a parametric test. The controls are submitted to substantially equivalent isogenic maize with the same diet composition, with all usual conditions exactly identical (genetic, temperature, light, space of caging, water and others). The time of exposure (weeks 5 and 14 corresponding, respectively, to 4 and 13 weeks of GMO diet), the sexes (males: m, females: f), and the dose (11 or 33% of GM maize in the equilibrated diet) are indicated.
| Parameters | Unit | Week | Sex | Dose (%) | Control | GMO |
|---|---|---|---|---|---|---|
| mean ± sem | mean ± sem | |||||
| BONE MARROW | ||||||
| Abs. lymphocytes | µL (X10E3) | 14 | f | 33 | 6.01 ± 0.62 | 4.65 ± 0.24 |
| Neutrophils | µL (X10E3) | 14 | m | 33 | 17.51 ± 0.7 | 11.60 ± 0.89 |
| Lymphocytes | % | 14 | m | 33 | 74.41 ± 0.58 | 80.53 ± 1.06 |
| Eosinophils (p) | % | 5 | m | 11 | 1 ± 0.11 | 1.38 ± 0.11 |
| Lar uni cell | % | 5 | f | 11 | 1.23 ± 0.09 | 1.64 ± 0.11 |
| HEART | ||||||
| Heart Wt | g | 14 | m | 33 | 1.78 ± 0.04 | 1.98 ± 0.06 |
| Heart % Body Wt | % | 14 | m | 33 | 0.33 ± 0.01 | 0.36 ± 0.01 |
| Heart % Brain Wt | % | 14 | m | 33 | 80.18 ± 2.18 | 87.22 ± 2.47 |
| KIDNEY | ||||||
| Urine Phosphorus | mg/dL | 5 | m | 33 | 110.73 ± 8.66 | 185.38 ± 11.13 |
| Urine Phosphorus | mg/dL | 5 | f | 33 | 182.35 ± 15.4 | 254.08 ± 23.65 |
| Urine Phosphorus | mg/dL | 14 | m | 33 | 88.69 ± 19.86 | 174.77 ± 9.75 |
| Urine sodium (p) | mmol/L | 14 | m | 33 | 30 ± 4.11 | 43.2 ± 4.33 |
| Urine potassium | mmol/L | 14 | m | 33 | 166.72 ± 22.95 | 223.90 ± 12.02 |
| Urine creat. clearance | mL/min/100 g/bw | 5 | m | 33 | 0.59 ± 0.05 | 0.84 ± 0.06 |
| Blood urea nitrogen | mg/dL | 5 | m | 11 | 14.02 ± 0.61 | 12.10 ± 0.29 |
| Blood urea nitrogen | mg/dL | 5 | m | 33 | 14.84 ± 0.75 | 12.93 ± 0.47 |
| Creatinine | mg/dL | 5 | m | 11 | 0.32 ± 0.02 | 0.24 ± 0.02 |
| Creatinine | mg/dL | 5 | m | 33 | 0.31 ± 0.01 | 0.24 ± 0.02 |
| Phosphorus | mg/dL | 5 | m | 33 | 8.02 ± 0.15 | 7.48 ± 0.17 |
| Potassium | mmol/L | 14 | f | 33 | 7.30 ± 0.15 | 8.22 ± 0.19 |
| LIVER | ||||||
| Liver Wt | g | 14 | m | 33 | 14.86 ± 0.32 | 16.34 ± 0.61 |
| Liver % Body Wt | % | 14 | m | 33 | 2.82 ± 0.04 | 2.96 ± 0.04 |
| Alkaline phosphatase | U/L | 14 | f | 11 | 41.10 ± 2.44 | 53 ± 4.014 |
MON 810: Effects of GMO treatment classified by organs, based on Table 2. See legend Table F.
| Parameters | Unit | Week | Sex | Dose (%) | Control | GMO |
|---|---|---|---|---|---|---|
| mean ± sem | mean ± sem | |||||
| ADRENAL | ||||||
| Adrenal Wt | g | 14 | f | 11 | 0.07 ± 0.01 | 0.08 ± 0.01 |
| Adrenal % Brain Wt | % | 14 | f | 11 | 3.42 ± 0.11 | 3.89 ± 0.16 |
| BONE MARROW | ||||||
| White Blood Cell Count | µL (X10E3 ) | 5 | f | 33 | 9.83 ± 1.34 | 8.16 ± 1.58 |
| Absolute lymphocytes | µL (X10E3 ) | 5 | f | 33 | 8.57 ± 1.17 | 7.11 ± 1.39 |
| Basophils | % | 14 | f | 33 | 0.79 ± 0.1 | 0.68 ± 0.13 |
| Lar uni cell (p) | % | 5 | f | 11 | 1.02 ± 0.32 | 1.39 ± 0.46 |
| KIDNEY | ||||||
| Kidney Wt (p) | g | 14 | f | 11 | 2.23 ± 0.19 | 2.38 ± 0.25 |
| Kidney % Brain Wt (p) | % | 14 | f | 11 | 109.76 ± 2.08 | 117.29 ± 2.84 |
| Blood urea nitrogen | mg/dL | 5 | f | 33 | 15.02 ± 2 | 17.11 ± 1.91 |
| LIVER | ||||||
| Albumin | g/dL | 5 | m | 33 | 4.24 ± 0.14 | 3.97 ± 0.2 |
| Albumin | g/dL | 14 | m | 33 | 4.44 ±0.16 | 4.15 ± 0.22 |
| albumin/globulin ratio | - | 5 | m | 33 | 1.97 ± 0.27 | 1.77 ± 0.22 |
| albumin/globulin ratio | - | 14 | m | 33 | 1.85 ± 0.18 | 1.66 ± 0.13 |
| SPLEEN | ||||||
| Spleen Wt | g | 14 | f | 11 | 0.54 ± 0.09 | 0.63 ± 0.24 |
| Spleen % Brain Wt | % | 14 | f | 11 | 26.39 ± 0.86 | 31 ± 2.42 |
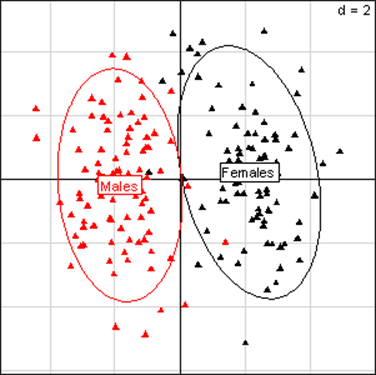
Principal Component Analysis for liver parameters in all rats of the MON 810 experiment. The scheme obtained for parameters at week 14 explains 62.48% of the total data variability (inertia) expressed on 2 axes (47.46% for factor 1; 15.02% for factor 2), scale d=2. This demonstrates the clear separation of parameters values according to sex.
Principal Component Analysis for kidney parameters in all rats of the MON 810 experiment. The scheme obtained for parameters at week 14 explains 43.16% of the total data variability (inertia) expressed on 2 axes (24.87% for factor 1; 18.29% for factor 2), scale d=2. This demonstrates the clear separation of parameters values according to sex.
Principal Component Analysis for liver parameters in all rats of the MON 863 experiment. The scheme obtained for parameters at week 14 explains 42.42% of the total data variability (inertia) expressed on 2 axes (32.01% for factor 1; 10.41% for factor 2), scale d=2. This demonstrates the clear separation of parameters values according to sex.
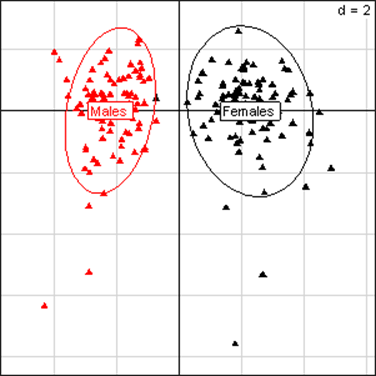
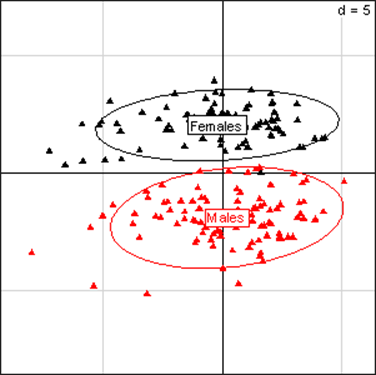
Principal Component Analysis for kidney parameters in all rats of the MON 863 experiment. The scheme obtained for parameters at week 14 explains 47.73% of the total data variability (inertia) expressed on 2 axes (26.95% for factor 1; 20.78% for factor 2), scale d=5. This demonstrates the clear separation of parameters values according to sex.
Author contact
![]() Correspondence to: Prof. Gilles-Eric Séralini, Institute of Biology, EA 2608, University of Caen, Esplanade de la Paix, 14032 Caen Cedex, France. Phone +33 2 31 56 56 84; Fax +33 2 56 53 20; Email: criigenfr.
Correspondence to: Prof. Gilles-Eric Séralini, Institute of Biology, EA 2608, University of Caen, Esplanade de la Paix, 14032 Caen Cedex, France. Phone +33 2 31 56 56 84; Fax +33 2 56 53 20; Email: criigenfr.
Received 2009-7-23
Accepted 2009-11-17
Published 2009-12-10