ISSN: 1449-2288International Journal of Biological Sciences

Int J Biol Sci 2012; 8(6):831-837. doi:10.7150/ijbs.4493 This issue Cite
Short Research Communication
Co-methylated Genes in Different Adipose Depots of Pig are Associated with Metabolic, Inflammatory and Immune Processes
Mingzhou Li1,2*, Honglong Wu3*, Tao Wang1, Yudong Xia3, Long Jin1, Anan Jiang1, Li Zhu1, Lei Chen4, Ruiqiang Li2 ![]() , Xuewei Li1
, Xuewei Li1 ![]()
1. Institute of Animal Genetics and Breeding, College of Animal Science and Technology, Sichuan Agricultural University, Ya'an, Sichuan, China;
2. Peking-Tsinghua Center for Life Sciences, Biodynamic Optical Imaging Center, and College of Life Sciences, Peking University, Beijing, China;
3. BGI-Shenzhen, Shenzhen, Guangdong, China;
4. Chongqing Academy of Animal Science, Chongqing, China.
*These authors contributed equally to this work.
Abstract
It is well established that the metabolic risk factors of obesity and its comorbidities are more attributed to adipose tissue distribution rather than total adipose mass. Since emerging evidence suggests that epigenetic regulation plays an important role in the aetiology of obesity, we conducted a genome-wide methylation analysis on eight different adipose depots of three pig breeds living within comparable environments but displaying distinct fat level using methylated DNA immunoprecipitation sequencing. We aimed to investigate the systematic association between anatomical location-specific DNA methylation status of different adipose depots and obesity-related phenotypes. We show here that compared to subcutaneous adipose tissues which primarily modulate metabolic indicators, visceral adipose tissues and intermuscular adipose tissue, which are the metabolic risk factors of obesity, are primarily associated with impaired inflammatory and immune responses. This study presents epigenetic evidence for functionally relevant methylation differences between different adipose depots.
Keywords: pig, subcutaneous adipose tissue, visceral adipose tissue, DNA methylation, MeDIP-seq
Introduction
Obesity is a strong risk factor for the development of type II diabetes mellitus, cardiovascular diseases, and associated metabolic syndrome [1]. An emerging view is that adipose tissue distribution in various locations of the body affects the development and progression of metabolic diseases more than total fat mass [2]. Adipose tissues from different areas of the body display distinct structural and biochemical properties and have disparate roles in pathology. It is well known that visceral adipose tissues (VATs), which are localized within the abdominal and thoracic cavities, have been shown to be correlated with an increased risk of insulin resistance and cardiovascular diseases [3, 4], whereas increase of subcutaneous adipose tissues (SATs) are associated with favorable plasma lipid profiles [5-7].
Recently, there has been a greater appreciation for the roles of DNA methylation markers, which can be very dynamic and alter gene expression in response to environmental and developmental cues without changing DNA sequences, in the development of obesity [8, 9]. Feinberg et al. (2010) identified four variably methylated regions correlated with body mass index and were located in or near genes previously implicated in the regulation of body weight or diabetes [10]. Wang et al. (2010) provided evidence that obesity is associated with genome-wide DNA methylation changes in peripheral blood leukocytes [11].
Pig models are ideal for studying human obesity, as they have many similarities in structure and function to humans, including size, digestive physiology, adipose distribution, and dietary habits [12, 13]. Of equal importance, the epigenetic understanding of pig adipose deposition will improve economic benefits in the pig industry.
To investigate the systematic association between DNA methylation and adipose deposition, we used a clustering method to identify sets of functionally co-methylated genes linked to obesity-related phenotypes based on the comprehensive genome-wide methylation data from eight adipose tissues from different body sites used in Li et al. [14].
Materials and Methods
Animals and tissue collection
Three females and three males at 210-day-old for each of the Landrace (a leaner, Western breed), the Tibetan (a feral, Chinese breed) and the Rongchang (a fatty, Chinese breed) pig breeds were used in this study. These pigs lived in comparable environments, but displayed distinct fat levels. The eight adipose tissues deposited in different body sites of each pig were sampled and divided into four groups: (1) three SATs (i.e. abdominal subcutaneous adipose (ASA), inner layer of backfat (ILB), and upper layer of backfat (ULB)); (2) three VATs from the abdominal cavity (i.e. greater omentum (GOM), mesenteric adipose (MAD), and retroperitoneal adipose (RAD)); (3) one VAT from the thoracic cavity (i.e. pericardial adipose (PAD)); and (4) intermuscular adipose (IAD). For detailed information regarding the animals and samples, please refer to Li et al. [14].
Measurements of obesity-related phenotype
The representative obesity-related phenotypes of 18 individuals were determined. The body density of each pig was calculated, as previously described [15]. The pig body is considered to be like a truncated cone where the base is represented by the abdomen (A), the top by the neck (N) and the length by the body size (BS). Pig body volume was defined (l) as:
Volume (l) = (π (BS/3) (cm) × {(A)2 (cm) + (N)2 (cm) + (A (cm) × N (cm) ) } ) × 10-3
where BS is the body size and A and N are the radius of the abdomen (A) and the neck (N).
It was then possible to determine the density in kg per litter as:
Density (kg·l-1) = BW (kg) / V(I)
Serum concentrations of total cholesterol (TC), triglycerides (TG), high density lipoprotein (HDL), low density lipoprotein (LDL), very-low density lipoprotein (VLDL), lactate dehydrogenase (LDH), apolipoprotein A-1 (Apo-A1) and apolipoprotein B (Apo-B) were determined in triplicates for each pig by using CL-8000 clinical chemical analyzer (Shimadzu, Tokyo, Japan). Serum levels of 16 cytokines, which are well known to be associated with adipose deposition, were measured in triplicates for each pig using a pig-specific ELISA kit (RuiCong, Shanghai, China). These analyzed molecules included adiponectin (Adipo), adiponectin receptor (AdipoR), C-peptide, cholecystokinin (CCK), gastrin receptor (GsaR), growth hormone (GH), highly sensitive C-reactive protein (hs-CRP), insulin, interleukin - 6 (IL-6), leptin (Lep), leptin receptor (LepR), orexin-B (OX-B), orexin receptor (OXR), plasminogen activator inhibitor-1 (PAI-1), tumor necrosis factor-α (TNF-α) and somatostatin (SS).
Adipocyte volume was measured in each of 144 adipose samples, as previously described [16]. All adipose tissues were embedded in paraffin, sliced at a thickness of 6 μm and stained with hematoxylin and eosin. The mean diameter of an adipocyte cell was calculated as the geometric average of the maximum and minimum diameter, and 100 cells were measured for each sample in randomly selected fields. The mean adipocyte volume (V) was obtained according to the following formula:
V = π/ 6 ∑fi Di3/ ∑fi
where Di is the mean diameter; fi denotes number of celles with that mean diameter Di.
Fatty acid composition was determined in each of 144 adipose samples using GC-14C gas chromatograph (Shimadzu), as previously described [17]. The fatty acid methyl esters were quantified and identified by comparison with standards previously run independently or together with samples. For more information, please refer to Li et al. [14].
Methylated DNA immunoprecipitation sequencing
In total, 144 adipose samples were used for the construction of methylated DNA immunoprecipitation (MeDIP) libraries, as we previously described [18], and sequenced separately using Illumina HiSeq 2000 sequencing system, which generated ∼1,125 Gb of sequence data. All MeDIP-seq data were deposited into the NCBI's Gene Expression Omnibus database under the GEO Series accession number GSE30344. We referred to the UCSC pig reference genome (Sscrofa9.2) annotation data for the identification of differentially methylated regions (DMRs) in 17,930 promoters (-2,200 to +500 bp) across eight variant adipose tissues using our newly developed methodology by calculating the variation of a single CpG site. For more details, please refer to Li et al. [14].
Identification of co-methylated gene sets linked with obesity-related phenotypes
In order to identify sets of functionally related genes with DMRs in their promoters that are linked to the phenotypic traits, we used a clustering method, as previously described [19], albeit with some modifications. Spearman rank correlation coefficients were determined between all possible gene-pairs across 18 individuals for each type of adipose tissue. The strongest correlated gene-pair was selected, and grouped together in a set that was assigned the average methylation value of the two genes that constituted the set. After the addition of this newly created set to the dataset, the two individual genes were removed from the data and the strongest correlation in the dataset was again selected. This resulted in either the expansion of a set already created or in the creation of a new set. We kept repeating this as an iterative process until the most significantly correlated pair had an r < 0.80. Only the sets containing 100 or more genes were kept for further analysis. The co-methylated gene sets that reflected the average methylation value of the genes constituting that set were correlated with each of 29 obesity phenotypic traits using a non-parametric Spearman rank correlation coefficient with Bonferroni correction.
Results and Discussion
Co-methylated gene sets linked with obesity-related phenotypes
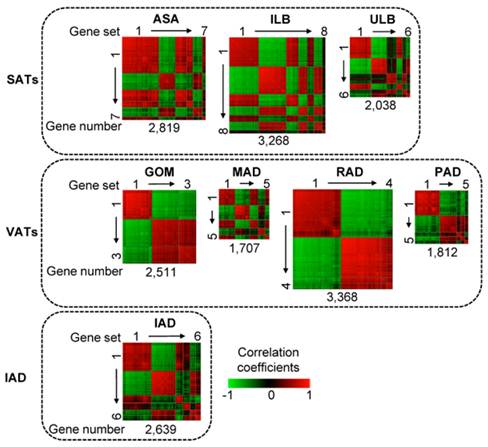
As shown in Fig. 1, in a total of eight adipose tissues, we identified 44 co-methylated gene sets containing 100 or more genes with DMRs in their promoters. These gene sets comprised different number of genes across different adipose tissues. For example, in ILB, 3,268 genes could be grouped into eight gene sets, whereas in GOM, 2,511 genes could be only grouped into three gene sets. Co-methylated genes within a single gene set are strongly correlated whereas genes that belong to different gene sets generally do not show strong co-methylation.
Heat map of co-methylated gene sets in eight adipose tissues. Three SATs (abdominal subcutaneous adipose (ASA), inner layer of backfat (ILB), upper layer of backfat (ULB)); four VATs (greater omentum (GOM), mesenteric adipose (MAD), retroperitoneal adipose (RAD), pericardial adipose (PAD)); and intermuscular adipose (IAD). Pair-wise correlations between genes residing in all the gene sets were plotted. Gene pairs strongly positively or negatively correlated are shown in red or green, respectively. Colour intensity represents the strength of the correlation. The co-methylated gene sets are indicated by squares and are ordered by the number of genes; thus with the largest gene set - containing the largest number of genes - in the upper left corner and the smallest gene set in the lower right corner.
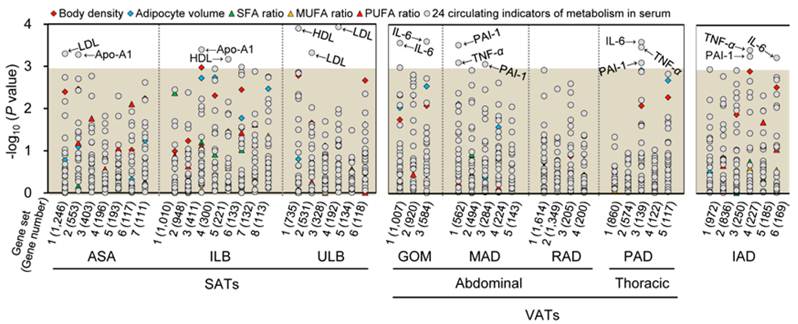
The gene sets of each adipose tissue were analyzed for correlation with various obesity-related phenotypic traits of 18 pigs. Seven, eight, and three gene sets of SATs, VATs and IAD were significantly associated with a trait after Bonferroni correction for multiple testing (P < 0.001), respectively (Fig. 2). To further define the biological mechanisms associated with the co-methylated genes that are correlated to the phenotypic traits of obesity, we also performed a functional enrichment analysis of genes with DMRs in promoters using DAVID software [20] (Table 1).
Correlations between co-methylated gene sets in eight adipose tissues and phenotypic traits of obesity. Log10 P-values for Spearman rank correlation coefficients between the methylation values of the gene sets and the different phenotypic traits of obesity are shown. The gray shadow represents the Bonferroni corrected P-values that are greater than 0.001. SFA, MUFA, and PUFA, denote saturated, monounsaturated, and polyunsaturated fatty acids, respectively.
Top ten Gene Ontology (GO) and KEGG pathway categories enriched for co-methylated gene sets that correlated with phenotypic traits of obesity.
| Correlated trait | Tissue (gene sets order No.) | Functional category | Term description | P value | Involved gene No. |
|---|---|---|---|---|---|
| Apo-A1 (Metabolic indicator) | ASA (2) ILB (3) | GO-BP | Cellular carbohydrate biosynthetic process | 0.002 | 12 |
| GO-BP | Regulation of small GTPase mediated signal transduction | 0.003 | 27 | ||
| GO-BP | Positive regulation of growth | 0.006 | 11 | ||
| GO-BP | Carbohydrate biosynthetic process | 0.008 | 14 | ||
| GO-MF | GTPase regulator activity | 0.009 | 35 | ||
| GO-MF | Small GTPase regulator activity | 0.009 | 27 | ||
| GO-BP | Glycerolipid metabolic process | 0.021 | 20 | ||
| GO-BP | Positive regulation of cell proliferation | 0.025 | 34 | ||
| GO-BP | Cholesterol metabolic process | 0.029 | 13 | ||
| GO-BP | Response to steroid hormone stimulus | 0.040 | 18 | ||
| HDL (Metabolic indicator) | ILB (5) ULB (1) | GO-MF | SH2 domain binding | 0.003 | 17 |
| GO-MF | Manganese ion binding | 0.008 | 25 | ||
| GO-BP | Gastrulation | 0.009 | 20 | ||
| GO-BP | Regulation of response to external stimulus | 0.009 | 26 | ||
| GO-MF | Enzyme activator activity | 0.013 | 34 | ||
| GO-BP | Regulation of growth | 0.015 | 34 | ||
| GO-BP | Regulation of smoothened signaling pathway | 0.016 | 16 | ||
| GO-BP | Positive regulation of anti-apoptosis | 0.018 | 17 | ||
| GO-BP | Striated muscle tissue development | 0.032 | 22 | ||
| GO-BP | Cell projection assembly | 0.032 | 20 | ||
| LDL (Metabolic indicator) | ASA (1) ULB (2,4) | GO-BP | Cellular carbohydrate biosynthetic process | 0.001 | 12 |
| GO-BP | Purine ribonucleoside triphosphate biosynthetic process | 0.002 | 15 | ||
| GO-BP | Cellular polysaccharide biosynthetic process | 0.002 | 8 | ||
| GO-BP | Positive regulation of biosynthetic process | 0.003 | 72 | ||
| GO-BP | ATP biosynthetic process | 0.003 | 14 | ||
| GO-BP | Ribonucleoside triphosphate biosynthetic process | 0.003 | 15 | ||
| GO-BP | Positive regulation of macromolecule biosynthetic process | 0.005 | 67 | ||
| GO-BP | Polysaccharide biosynthetic process | 0.005 | 10 | ||
| GO-MF | Transferase activity, transferring nitrogenous groups | 0.005 | 8 | ||
| GO-BP | Lipopolysaccharide metabolic process | 0.007 | 4 | ||
| IL-6 (Inflammatory and immune adipokine) | GOM (1,3) PAD (3) IAD (4) | GO-BP | Regulation of cell morphogenesis involved in differentiation | 0.001 | 18 |
| GO-BP | Response to hypoxia | 0.005 | 25 | ||
| GO-BP | Gliogenesis | 0.011 | 16 | ||
| GO-BP | Immune response-activating cell surface receptor signaling | 0.013 | 13 | ||
| GO-MF | Steroid hormone receptor binding | 0.013 | 13 | ||
| GO-BP | Regulation of cell morphogenesis | 0.023 | 22 | ||
| GO-BP | Positive regulation of leukocyte chemotaxis | 0.023 | 9 | ||
| GO-BP | Immune response-regulating cell surface receptor signaling | 0.023 | 13 | ||
| GO-BP | Regulation of cAMP metabolic process | 0.031 | 19 | ||
| GO-BP | Regulation of leukocyte chemotaxis | 0.033 | 9 | ||
| TNF-α (Inflammatory and immune adipokine) | MAD (1) PAD (3) IAD (4) | GO-BP | Leukocyte differentiation | 0.003 | 16 |
| GO-BP | B cell activation | 0.004 | 13 | ||
| GO-BP | Cellular component morphogenesis | 0.005 | 28 | ||
| GO-BP | Lymphocyte differentiation | 0.008 | 15 | ||
| GO-BP | B cell differentiation | 0.012 | 11 | ||
| GO-MF | Small GTPase regulator activity | 0.014 | 22 | ||
| GO-BP | Hemopoietic or lymphoid organ development | 0.020 | 21 | ||
| KEGG | Primary immunodeficiency pathway | 0.020 | 10 | ||
| GO-BP | Regulation of T cell activation | 0.034 | 14 | ||
| GO-BP | Immune system development | 0.036 | 21 | ||
| PAI-1 (Inflammatory and immune adipokine) | MAD (1,3) PAD (3) IAD (4) | GO-BP | Leukocyte differentiation | 0.004 | 18 |
| GO-MF | Magnesium ion binding | 0.005 | 38 | ||
| GO-BP | Lymphocyte differentiation | 0.006 | 17 | ||
| KEGG | Primary immunodeficiency pathway | 0.007 | 11 | ||
| GO-BP | Hemopoiesis | 0.009 | 25 | ||
| GO-BP | B cell activation | 0.009 | 14 | ||
| GO-BP | Hemopoietic or lymphoid organ development | 0.013 | 25 | ||
| GO-BP | T cell differentiation | 0.015 | 13 | ||
| GO-BP | T cell differentiation in the thymus | 0.020 | 10 | ||
| GO-BP | Immune system development | 0.029 | 25 |
In all tests, the unified set of co-methylated genes for different adipose depots that correlated to a phenotypic trait of obesity were compared with all known genes, which served as the background. P values (i.e. corrected EASE score), which indicated the significance of the overlap between various gene sets, was calculated using Benjamini-corrected modified Fisher's exact test. BP, biological process; MF, molecular function.
SATs are associated with metabolic processes
As shown in Fig. 2, the co-methylated genes in SATs modulate three metabolic indicators in serum, specifically Apo-A1, HDL and LDL. These indicators are primarily involved in metabolic processes, such as cellular carbohydrate biosynthesis, cholesterol, glycerolipid, and lipopolysaccharide metabolism, and biosynthesis of cellular carbohydrates, polysaccharides, and macromolecules (Table 1).
This finding corroborated the notion that SATs, which are distributed over the body's surface in the hypodermal layer of the skin, mainly contribute to metabolism, and have direct and beneficial effects on the maintenance of body weight and metabolism [5-7]. It is noteworthy that, in most regions of the human and pig bodies, SAT is anatomically separated by a stromal fascia into superficial and deep SATs [21]. Walker et al. (2007) reported that compared to human superficial SAT, deep SAT appears to be a distinct adipose depot that supports an independent metabolic function and may be associated with the risk of obesity-associated complications [22]. Nonetheless, similar to the upper layer of porcine backfat (i.e. ULB), the co-methylated genes in the inner layer of porcine backfat (i.e. ILB) were related to two metabolic indicators (i.e. Apo-A1 and HDL), and were also mainly enriched in metabolic-related Gene Ontology (GO) terms (Fig. 2). Currently, little is known about the species-specific differences in the distribution of adipose tissues, and future comprehensive comparisons of physiological and biochemical characteristics between humans and pig will be beneficial in ascertaining this discrepancy in the results.
VATs are attributed to inflammatory and immune processes
As shown in the Fig. 2, apart from RAD, co-methylated genes in the other three VATs (i.e. GOM, PAD and MAD) were found to primarily affect three inflammatory and immune adipokines in serum: IL-6, PAI-1 and TNF-α. These adipokines are markedly involved in the differentiation of B-cells, T-cells, leukocytes, and lymphocytes, and in the development of the immune system, and hemopoietic and lymphoid organs. Consequently, these adipokines further attribute to the obesity-induced chronic inflammation in adipose tissue that precedes the development of insulin resistance and type II diabetes mellitus [23-25].
It is believed that the distribution of adipose is an important predictor of metabolic abnormalities, rather than total adipose mass [3, 4]. VATs are located within the abdominal cavity (i.e. GOM and MAD), and have been recognized to be anatomically, functionally, and metabolically distinct from SATs [3, 26]. Differences between VATs and SATs arise from the different genetic differentiation of pre-adipocytes and the influence of the local microenvironment [26]. The venous drainage of abdominal VATs is via the portal system, which directly provides free fatty acids (FFAs) as substrates for hepatic lipoprotein metabolism and glucose production [27]. Compared with SATs, VATs are more cellular, vascular, innervated, and contain a larger number of inflammatory and immune cells [25]. VAT adipocytes are more metabolically active and have a greater capacity to generate FFAs and uptake glucose than SATs, while SATs are more avid in absorbing circulating FFAs and triglycerides [2]. A recent study on the autologous transplantation of VATs to subcutaneous sites suggested that the DNA methylation status of the promoters of adipokine genes across different adipose depots are anatomic location-specific, and are influenced by the impact of local (residence) factors [5]. With the exception of GOM and MAD, we did not identify gene sets of RAD that are significantly associated with a phenotypic trait of obesity. This may be attributed to its special anatomical location, which surrounds the kidneys at the dorsal side of the abdominal cavity. Blood from omental GOM and mesenteric MAD drains into the portal vein, while blood from retroperitoneal RAD does not.
Interestingly, we also found that the co-methylated genes of PAD, which is located within the thoracic cavity and surrounds the heart, primarily affect inflammatory and immune adipokines (i.e. IL-6, PAI-1 and TNF-α) (Fig. 2). This observation confirms the evidence that PAD is a correlative risk factor for cardiovascular disease [28], especially coronary heart disease owing to the marked feature of inflammation [29]. Additionally, similar to high-risk VATs, the co-methylated genes of intermuscular IAD, which is believed to provide fuel for skeletal muscle contraction, were found to affect IL-6, PAI-1 and TNF-α (Fig. 2), suggesting that it is an independent risk factor for metabolic diseases [30].
Conclusion
The present study found that intrinsic methylation differences between various adipose depots are dependent on their localization. Additionally, we presented epigenetic evidence that both VATs and IAD, which are metabolic risk factors of obesity, are also associated with an impaired immune response. Our observations suggest a potential strategy for the development of future epigenetic biomarkers for the prediction and prevention of obesity.
Acknowledgements
This work was supported by grants from the National Special Foundation for Transgenic Species of China (2009ZX08009-155B and 2011ZX08006-003), the Project of Provincial Twelfth 5 Years' Animal Breeding of Sichuan Province (2011-YZGG-15) and the International Science & Technology Cooperation Program of China (2011DFB30340) to X.L., and the National Natural Science Foundation of China (30901024) to M.L.
Competing Interests
The authors have declared that no competing interest exists.
References
1. Despres JP, Lemieux I. Abdominal obesity and metabolic syndrome. Nature. 2006;444(7121):881-887
2. Wronska A, Kmiec Z. Structural and biochemical characteristics of various white adipose tissue depots. Acta Physiol. 2012;205:194-208
3. Ibrahim MM. Subcutaneous and visceral adipose tissue: structural and functional differences. Obes Rev. 2010;11(1):11-18
4. Dulloo AG, Jacquet J, Solinas G. et al. Body composition phenotypes in pathways to obesity and the metabolic syndrome. Int J Obes. 2010;34(Suppl 2):S4-S17
5. Satoor SN, Puranik AS, Kumar S. et al. Location, location, location: beneficial effects of autologous fat transplantation. Sci Rep. 2011 doi:10.1038/srep00081
6. Tran TT, Yamamoto Y, Gesta S. et al. Beneficial effects of subcutaneous fat transplantation on metabolism. Cell Metab. 2008;7(5):410-420
7. Amati F, Pennant M, Azuma K. et al. Lower Thigh subcutaneous and higher visceral abdominal adipose tissue content both contribute to insulin resistance. Obesity. 2012;20:1115-1117
8. Lavebratt C, Almgren M, Ekstrom TJ. Epigenetic regulation in obesity. Int J Obes. 2011 doi:10.1038/ijo.2012.8
9. Pirola L, Balcerczyk A, Okabe J. et al. Epigenetic phenomena linked to diabetic complications. Nat Rev Endocrinol. 2010;6(12):665-675
10. Feinberg AP, Irizarry RA, Fradin D. et al. Personalized epigenomic signatures that are stable over time and covary with body mass index. Sci Transl Med. 2010 doi:10.1126/scitranslmed.3001262
11. Wang X, Zhu H, Snieder H. et al. Obesity related methylation changes in DNA of peripheral blood leukocytes. BMC Med. 2010;8:87
12. Lunney JK. Advances in swine biomedical model genomics. Int J Biol Sci. 2007;3(3):179-184
13. Spurlock ME, Gabler NK. The development of porcine models of obesity and the metabolic syndrome. J Nutr. 2008;138(2):397-402
14. Li M, Wu H, Luo Z. et al. An atlas of DNA methylomes in porcine adipose and muscle tissues. Nat Commun. 2012 doi:10.1038/ncomms1854
15. Sebert SP, Lecannu G, Kozlowski F. et al. Childhood obesity and insulin resistance in a Yucatan mini-piglet model: putative roles of IGF-1 and muscle PPARs in adipose tissue activity and development. Int J Obes. 2005;29(3):324-333
16. Li M, Zhu L, Li X. et al. Expression profiling analysis for genes related to meat quality and carcass traits during postnatal development of backfat in two pig breeds. Sci China Ser C. 2008;51(8):718-733
17. De Campos R, Hierro E, Ordez J. et al. Fatty acid and volatile compounds from salami manufactured with yerba mate (Ilex paraguariensis) extract and pork back fat and meat from pigs fed on diets with partial replacement of maize with rice bran. Food Chem. 2007;103(4):1159-1167
18. Li N, Ye M, Li Y. et al. Whole genome DNA methylation analysis based on high throughput sequencing technology. Methods. 2010;52(3):203-212
19. Wolfs MG, Rensen SS, Bruin-Van Dijk EJ. et al. Co-expressed immune and metabolic genes in visceral and subcutaneous adipose tissue from severely obese individuals are associated with plasma HDL and glucose levels: a microarray study. BMC Med Genomics. 2010;3:34
20. Huang da W, Sherman BT, Lempicki RA. Systematic and integrative analysis of large gene lists using DAVID bioinformatics resources. Nat Protoc. 2009;4(1):44-57
21. Sbarbati A, Accorsi D, Benati D. et al. Subcutaneous adipose tissue classification. Eur J Histochem. 2010;54(4):e48
22. Walker GE, Verti B, Marzullo P. et al. Deep subcutaneous adipose tissue: a distinct abdominal adipose depot. Obesity. 2007;15(8):1933-1943
23. Iyer A, Fairlie DP, Prins JB. et al. Inflammatory lipid mediators in adipocyte function and obesity. Nat Rev Endocrinol. 2010;6(2):71-82
24. Torres-Leal FL, Fonseca-Alaniz MH, Rogero MM. et al. The role of inflamed adipose tissue in the insulin resistance. Cell Biochem Funct. 2010;28(8):623-631
25. Schaffler A, Scholmerich J. Innate immunity and adipose tissue biology. Trends Immunol. 2010;31(6):228-235
26. Yamamoto Y, Gesta S, Lee KY. et al. Adipose depots possess unique developmental gene signatures. Obesity. 2010;18(5):872-878
27. Hannukainen JC, Kalliokoski KK, Borra RJ. et al. Higher free fatty acid uptake in visceral than in abdominal subcutaneous fat tissue in men. Obesity. 2010;18(2):261-265
28. Bosy-Westphal A, Kossel E, Goele K. et al. Association of pericardial fat with liver fat and insulin sensitivity after diet-induced weight loss in overweight women. Obesity. 2010;18(11):2111-2117
29. Tadros TM, Massaro JM, Rosito GA. et al. Pericardial fat volume correlates with inflammatory markers: the Framingham heart study. Obesity. 2010;18(5):1039-1045
30. Yim JE, Heshka S, Albu J. et al. Intermuscular adipose tissue rivals visceral adipose tissue in independent associations with cardiovascular risk. Int J Obes. 2007;31(9):1400-1405
Author contact
![]() Corresponding author: R.L. (E-mail: lirqedu.cn) or X.L. (E-mail: xuewei.liedu.cn).
Corresponding author: R.L. (E-mail: lirqedu.cn) or X.L. (E-mail: xuewei.liedu.cn).
Received 2012-4-19
Accepted 2012-6-4
Published 2012-6-10